FIGURE SUMMARY
Title

Celsr1a is essential for tissue homeostasis and onset of aging phenotypes in the zebrafish

Authors
Li, C., Barton, C., Henke, K., Daane, J., Treaster, S., Caetano-Lopez, J., Tanguay, R.L., Harris, M.
Source
Full text @ Elife

Identification of a zebrafish mutant, <italic>fruehrentner</italic> (<italic>frnt</italic>), exhibiting late phenotypes that resemble normal aging.

(A–C) Aging phenotypes of young frnt mutant and old wild-type (wt) zebrafish. (B) Appearance of adult frnt mutant showing ruffled appearance and kyphosis at young adult stages closely resembles that of old fish (C) compared to a (A) wild-type fish of similar age. (D) frnt shows progressive loss of survival compared with wild-type fish.

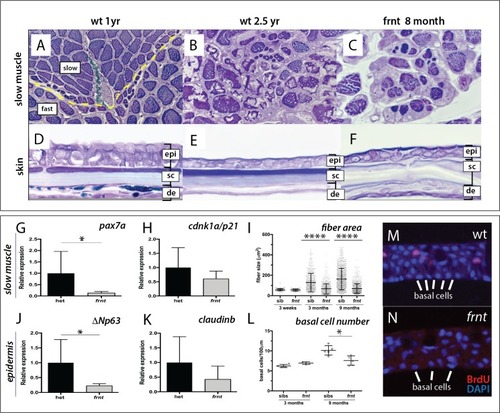
(A–F) Direct comparison of frnt with young adult, (A, D) and naturally aging wild-type zebrafish (2.5 years; (B, E). Similar degenerative pathologies are shared between aged zebrafish (B, E) and 8 month-old mutants (C, F), such as fibrosis and sarcopenia of slow muscle fibers (B, C), and thinning skin (E, F). (G–I) Characterization of slow muscle phenotype in frnt mutants. (G) Expression analysis of stem cell marker paired-box 7a (pax7a, n = 6) and (H) cdnk1a/p21 control in slow muscle from 7 month old homozygous (n = 6) and heterozygous mutant fish (n = 9). (I) Adult frnt has smaller fiber size in slow muscle compared to age-matched wild type and sibling fish (3 month (n = 5) and 9 month old (n = 9), but not as juvenile fish (3 week old, n = 3). (J–L) Changes in epidermal phenotype in frnt mutants. (J) Expression of the stem cell marker delta-Np63 and (K) control claudin-b in epidermal tissues from 7 month old homozygous (n = 12) and heterozygous (n = 5–6) frnt fish. (L) Count of DAPI positive basal cells in the integumentary epithelium in 3 (n = 3–4) and 9 month old (n = 5) frnt fish. (M–N). DAPI stained epidermal nuclei in wild-type (M) and frnt (N) mutant epidermis. Error represented as mean +/- standard deviation. ****p<0.0001, *p<0.05.

c<italic>elsr1a</italic> affects mitochondrial proliferation and maintenance.

(A) Schematic of hemisected zebrafish flank with position of midline slow muscle populations outlined. (B) Histological section of flank of a mature zebrafish showing organization of individual muscle fibers at the midline; Haematoxylin-eosin stain; yellow dotted line indicates boundary between slow and fast muscles. (C–G) Transmission electron micrographs of slow muscle fibers showing medial and peripheral mitochondria (mt) from wild-type (C,E) and frnt mutant (D,F,G). frnt mutants show mitochondrial phenotypes of hyperproliferation (D, F), and evidence of degeneration (G).

<italic>frnt</italic> mutation does not affect senescence biomarkers.

(A) Southern blot of genomic DNA of zebrafish telomerase reverse transcriptase (tert) and frnt mutants probed for telomere repeats. Data shows no effect of the mutation on telomere length in the frnt mutant compared with significant decrease of intensity and size of telomere in tert deficient fish. Arrow points to upper size expected for zebrafish telomeres; n = 4 for each group. (B–E). Senescence-associated beta-galactosidase (SA-βgal) staining (blue) of frnt mutants. (B, C) Positive signal of senescence as shown in 5 month old tert mutants (C), n = 3) compared with their heterozygous controls (B), n = 3). Comparably staged wild-type and frnt adults (E), n = 4) show resting levels of SA-βgal signal. Samples were counterstained with nuclear red.

Identification of altered <italic>celsr1a</italic> function underlying the <italic>frnt</italic> phenotype.

(A) Mapping by homozygosity-by-descent indicates linkage of frnt to chromosome 4. (B) Mapping score across chromosome 4. (C) Analysis of heterogeneity across chromosome four showing a broad region of homogeneity in the population indicating linkage. (D) Fine mapping of frnt showing limited recombination and resolution of the map position along chromosome 4; white bar, area showing linkage; red hashmark, position of celsr1a; top, position (megabase, Mb) on chromosome 4, zv9 assembly (https://ensembl.org); bottom number of recombinants per meiosis (rec/me) scored. (E) Chemical mutagenesis loss-of-complementation screen to identify the gene mutation underlying the frnt phenotype. Exome sequencing of identified founders having the frnt phenotype (frnt/*), identified mutations in the celsr1a gene within the mapped interval (mh36, C1693X). (F) Identified deletions/insertions within celsr1a generated through CRISPR/Cas9 genome editing that fail to complement frnt. Recovered sequences from F1 founders; guideRNA position demarcated with overlain red bar. Of the recovered lines, allele mh104_P2027A-fs11X was retained G) Identification of transposon insertion within celsr1a in frnt.H) Schematic of celsr1a and position of identified mutations.

<italic>celsr1a</italic> expression during development and as a function of age in adults.

(A) Strategy for GFP insertion at the celsr1a endogenous locus by homology directed repair. (B) Whole mount in situ analysis of celsr1a expression in early development (1dpf). (C) Expression of celsr1a in central nervous system (CNS), peripheral nervous system (PNS), and gut in the celsr1aGFP/+ transgenic line. (D–J) Expression of celsr1aGFP/+ transgene in larval, and juvenile zebrafish showing progressive restriction and localization to specific cell types and tissues. all, anterior lateral line; epi, epidermal cells; int, intestine; mph, metanephros; nm, neuromast; sl m, slow muscle; ot, otolith. (K–M) Restricted expression of celsr1aGFP in adult tissues. (K) Expression of celsr1aGFP in adult skin and neuromasts covering the lateral surface. (L–M) Expression of celsr1a is shown in anterior and posterior regions of the adult intestine.

Loss of <italic>celsr1a</italic> leads to altered polarity phenotypes in the zebrafish integument.

(A–B) Alizarin red stained adult wild-type zebrafish showing pattern of scales on the flank. (A). Wild-type fish showing normal, regularly spaced pattern of scales whereas, in (B) frnt mutants show altered patterning of scales across the flank, creating swirls. (C) Wild-type scale showing internal polarity of growth along the rostrocaudal axis (bottom to top). (D) frnt scale showing radial pattern of growth rings (annuli), without the internal polarity normally observed in wild-type. (E) Quantification of polarity in wild-type sibling and frnt scales (n = 6 fish,>25 scales each side) as indicated by the ratio of the center-to-base normalized by the diameter for each scale (C, D). Data presented as mean ± standard deviation; ****p<0.001.

PHENOTYPE:
Fish:
Observed In:
Stage: Adult

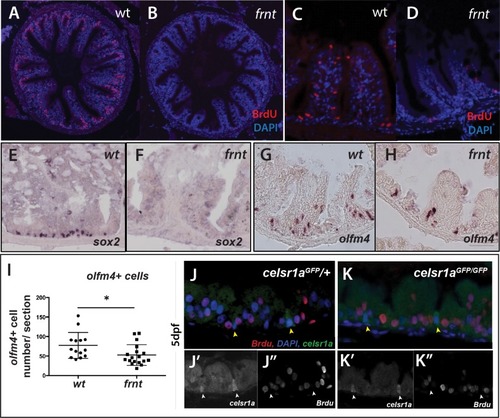
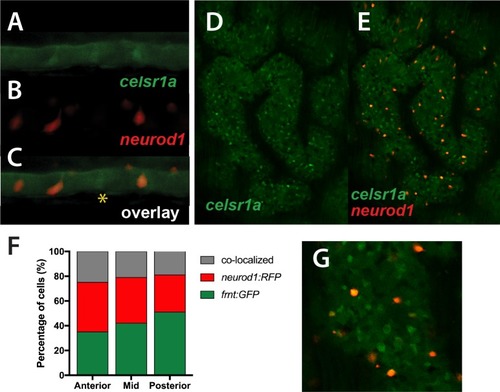
(A–D) Analysis of proliferative capacity of the adult intestine in celsr1a mutants and age matched wild-type fish (pulse injection and incorporation after 4 hr (red), nuclei counterstained by DAPI. (A, B) Low power view of comparable posterior regions of intestine of wild-type (A) and age and size matched frnt mutants (B). (C, D) Close up of intestinal rugae showing cells incorporating BrdU. (E–H), in situ hybridization of expression of sex-determining region Y-box 2 (sox2) (E, F) and olfactomedin 4 (olfm4). (G, H) genese in adult intestinal epithelia of wild-type (E, G) and celsr1a mutant (F, H) zebrafish. (I) Quantitation of changes in the number of olfm4+ cells observed in mutants; data presented as mean +/- standard deviation, *p<0.05, n = 5 (wt sibling), n = 7 (frnt) (J–K) Proliferative cells (24 hr after BrdU pulse, red) in comparison to celsr1a expression (green, yellow arrowhead) in larval developing intestine at 5dpf in (J) ceslr1aGFP heterozytotes and (K) ceslr1aGFP mutants; DAPI, blue. Insets J’ and J’’ and K’ and K’’are separate channels showing celsr1a expression and Brdu detection, respectively in the same tisse.

c<italic>elsr1a</italic> affects intestine growth and homeostasis.

(A) Schematic of adult zebrafish intestine showing plane of section demarcating anterior (a), middle (m), and posterior (p) domains of the intestine for analysis (after Wallace et al., 2005). (B) Histomorphology of 6 month-old wild-type sibling (wt) adult intestine showing decreasing circumference along the length of the intestine and prominent rugae growing up into the intestinal lumen. (C) Intestine of age and size matched frnt mutants. Sections stained with periodic acid-Schiff stain (PAS). (D) Quantitation of intestine area in different gut regions in wt sibling (n = 5) and frnt mutants (n = 6); data represented as mean ± standard deviation, **p<0.01; E–H). PAS and Alcian blue staining of rugae from posterior intestine from wild-type (E–F) and frnt mutant fish. Inset (E, G) showing area of F, H. Scale bars represent 100 μm.

Cell cycling is diminished in <italic>celsr1a</italic> mutant intestinal epithelia.

(A–C) Different lengths of chase after Bromodeoxyuridine (BrdU) treatment of 6 months-old frnt and wild-type (wt) control fish. (A) 5 hr (n = 5/group); (B) 24 hr (n = 6/group) and (C) 48 hr chase. (n = 5/group) (D) Analysis of phospho-histone H3 (pH3). Measured number of positive cells per intestinal rugae from anterior, middle and posterior positions of the gut. 3–4 fish were used per treatment group. Data represented as mean ± standard deviation, *p<0.05. Lower values specifically in Panel C in the anterior group maybe due to localized smaller number or rugae within those sections.

Colocalization of <italic>celsr1a</italic> and <italic>neurod1</italic> positive sensory enteroendocrine cells during development.

(A–C) Co-expression of celsr1a (celsr1aGFP/+) and neurod1 (Tg(neurod1:TagRFP)) in four dpf intestine; asterisk highights celsr1a+ without neurod1 expression; all pictures luminal side placed on top. (C) Overlay, shows predominant co-localization early in this cell population. Expression was seen in all larvae analyzed (n = 6). (D–E) Expression of Tg(celsr1GFP) and neurod1 in 5 month old adult zebrafish intestine. Area pictured is from the middle intestinal region. (F) Quantitation of expression and overlap between markers (n = 6, 1–4 pictures/fish/region). (G) Close up of overlay showing distinct marked cell populations.

EXPRESSION / LABELING:
Genes:
Fish:
Anatomical Terms:
Stage Range: Day 4 to Adult

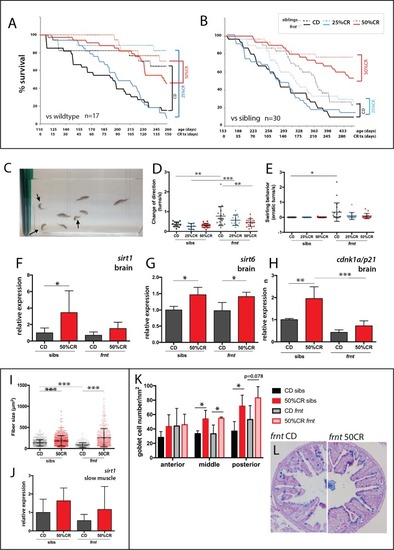
(A–C) Effects of specialized diets, having no restriction (control diet (CD), black), 25% (blue) or 50% (red) calorie restriction (CR), on viability of zebrafish; solid line, frnt mutant; dotted line, control fish. (A–B) The effect of the specific dietary reduction in calories on survival in frnt; 50%CR lead to significant increase in survival of mutant and siblings compared to control and 25%CR; differences between 50%CR diets for both mutant and siblings are all significant (p<0.001) compared to control and 25%CR by Mantel-Cox and Geha-Brelow-Wilcoxon tests. (C–E) Caloric restriction ameliorates aberrant swimming behavior in celsr1a mutants. (C) High frequency turning behavior of mutants in tank (arrows). Quantitation of change in direction (D) and erratic turns (E) in treatment groups with different levels of caloric reduction. (F–H) Expression of genes associated with senescence and lifespan in brain tissue of wild type and celsr1a mutants in different dietary treatments: (F) sirt1; (G) sirt6 and (H) cdnk1a/p21; data represented as mean ± standard deviation. (I–J) Effect of caloric restriction on slow muscle fiber area in wild-type and celsr1a mutant adult zebrafish. (I) Slow muscle fiber area is potentiated in response to 50%CR in both wild-type and mutants. (J) sirt1 expression in slow muscle from different diet treatment groups. (K–M), Effect of caloric restriction on intestinal differentiation phenotypes of wild-type celsr1a mutant adults. (K) goblet cell number quantitated from different regional areas of the gut in CD and 50%CR treatment groups. Data presented as mean + /- standard deviation, *p<0.05, paired t-test, n = 4 (frnt), n = 3 (sibs). (L) Goblet cell morphology in CD and 50%CR treated mutant posterior intestine.

Analysis of weight in caloric restricted zebrafish.

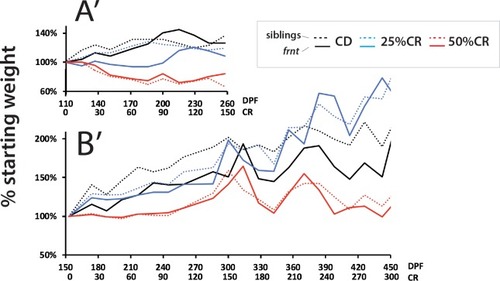
Analysis of average weight per treatment group for both experiments (A’ and B’, respective to experimental results in
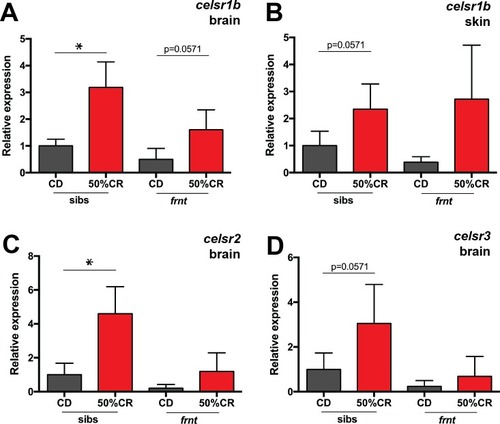
 Figure 9); panel A’ is set to the same relative time frame of CR as B’ for comparison.

Compensatory responses of <italic>celsr1</italic> homologues to caloric restriction.

qRT-PCR analysis of celsr1 homologues in frnt and wild-type sibling fish raised on normal and restricted diet (50% calorie restriction). Samples derived from 9 month old fish at end of treatment (after 5 month diet; n = 4 per genotype). (A–B) Expression of celsr1b paralogue in brain (A) and skin tissue (B). (C–D) Expression of orthologues celsr2 (C) and celsr3 (D) in brain tissue. *p<0.05; data represented as mean + /- standard deviation.

Morphology of caloric restricted zebrafish.

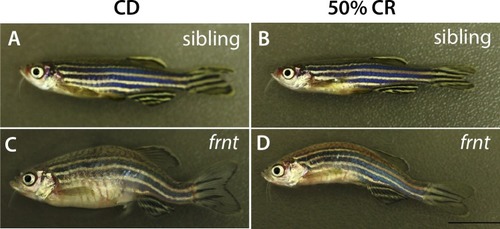
Representative adult fish after feeding regimen of control or calorie restricted (CR) diet. (A–B) frnt siblings showing healthy outward appearance in control (A) or 50% CR groups (B). frnt mutants retained outward aging appearance after being fed a 50% caloric restricted diet (D) with comparable kyphosis and scale defects as seen in control treated animals (C).

Unillustrated author statements

Acknowledgments
This image is the copyrighted work of the attributed author or publisher, and ZFIN has permission only to display this image to its users. Additional permissions should be obtained from the applicable author or publisher of the image. Full text @ Elife