
- Title
-
Efficient Front-Rear Coupling in Neutrophil Chemotaxis by Dynamic Myosin II Localization
- Authors
- Tsai, T.Y., Collins, S.R., Chan, C.K., Hadjitheodorou, A., Lam, P.Y., Lou, S.S., Yang, H.W., Jorgensen, J., Ellett, F., Irimia, D., Davidson, M.W., Fischer, R.S., Huttenlocher, A., Meyer, T., Ferrell, J.E., Theriot, J.A.
- Source
- Full text @ Dev. Cell
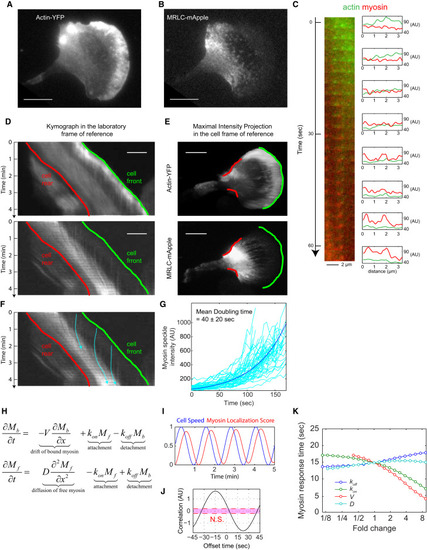
MRLC Retrograde Flow and Membrane Retraction Facilitate the Rapid Coupling between Protrusion and Myosin II Redistribution (A and B) TIRF images of (A) actin-YFP and (B) MRLC-mApple, coexpressed in an HL60 cell. The images are representative of 20 different cells. Scale bars in (A), (B), (D), and (E) represent 10 μm. (C) A magnified image sequence showing the transition from actin puncta to myosin puncta. The image at the left is a montage of the same region in the laboratory frame of reference over a 63-s period. The diagrams at the right show the fluorescence intensity of line scans from the corresponding image at the left. In the lab frame of reference, the actin and myosin puncta at the front of the cell remain static relative to the substrate. (D) Kymographs of actin-YFP (top) and MRLC-mApple (bottom) in the lab frame of reference. Each row of the kymograph is obtained by a 2.6-μm-wide line scan through the middle of the cell along the migration direction. Cell is migrating toward the right. The green line corresponds to the green leading edge in (E) and the red line corresponds to the red retracting edge in (E). (E) Maximal intensity projection of actin-YFP (top) and MRLC-mApple (bottom) in the cell frame of reference, showing the direction of actin (top) and MRLC (bottom) retrograde flow. The image integrated the fluorescent signals over a 96-s period. Green color marks the leading edge and red color marks the retracting edge. Image contrast in (A), (B), and (E) was adjusted to emphasize the actin and myosin puncta. (F) The trajectories of three individual myosin puncta (blue). (G) The rate of increase in fluorescence intensity from 67 MRLC puncta in a single cell was measured to estimate the binding rate of myosin to F-actin (see STAR Methods). The average apparent doubling time for myosin accumulation was 40 ± 20 s. (H) A partial differential equation model in one dimension with only two variables: Mb is the bound myosin and Mf is the cytoplasmic (free) myosin. The four parameters are V (velocity of the retrograde flow), D (diffusion coefficient of the cytoplasmic myosin), kon (attachment rate of myosin to F-actin), and koff (detachment rate of bound myosin from F-actin). (I) The response of the myosin localization score to a simulated oscillatory speed with a period of 1.25 min. (J) The cross-correlation analysis between the cell speed and the myosin localization score generated a temporal offset of 15 s. (K) A sensitivity analysis of the response time of myosin when each of the four parameters are tuned up or down 9-fold. |
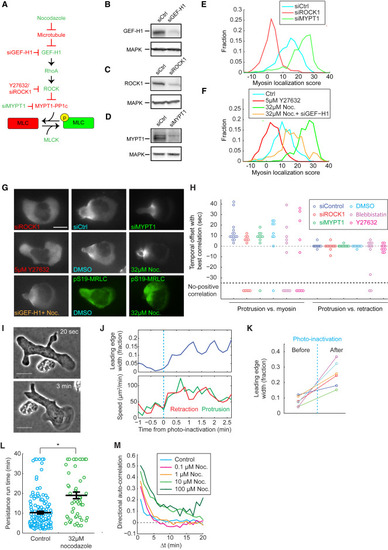
Intracellular Myosin Distribution Depends on Phosphorylation of Myosin Regulatory Light Chain Myosin contractility is dispensable for front-rear coupling, but affects leading edge dynamics. (A) A signaling cascade regulating MRLC phosphorylation. A protein or perturbation that increases or decreases MRLC phosphorylation are colored green or red, respectively. (B–D) Western blots of HL60 cell lysates on GEF-H1 (B), ROCK1 (C), MYPT1 (D), and MAPK (B–D), showing the effective knockdown of GEF-H1 (B), ROCK1 (C), and MYPT1 (D) by siRNA. Each blot has been repeated 2 or 3 times. (E and F) Histogram of myosin rearward localization score under different conditions. Sample sizes in the format of (number of images, number of cells): siCtrl (726, 66), siROCK1 (649, 59), siMYPT1 (737, 67) (E), and control (275, 55), Y27632 (220, 44), nocodazole (285, 57), and nocodazole + siGEF-H1(506, 46) (F). (G) Representative snapshots of MRLC-mApple fluorescent images of HL60 cells under different treatments. The two images in green are HL60 cells immunostained with antibody targeting pS19-MRLC. Scale bar represents 10 μm. (H) Summary of the temporal offset between protrusion and retraction (right), and between protrusion and myosin rearward localization score (left). Sample sizes in the format of (number of videos, number of cells): siControl (14, 10), siROCK1 (12, 12), siMYPT1 (10, 7), DMSO control (9, 6), 10μM blebbistatin (11, 11), 10uM Y27632 (10, 10). (I) Snapshots of a blebbistatin-treated cell 20 s before and 3 min after photo-inactivation. Scale bar represents 10 μm. (J) Leading edge, protrusion, and retraction speed before and after blebbistatin photo-inactivation for the cell shown in (I). In (J–K), leading edge width is calculated as the fraction of cell circumference that is actively protruding. Protrusion and retraction speed are defined as in Figure 1B. (K) Change of leading edge width from 6 cells in 3 experiments before and after blebbistatin photo-inactivation. The representative cell shown in (I) and (J) corresponds to the data points in green. (L) Persistence run time for control and nocodazole-treated cells. Each circle represents the average persistence run time for one single cell over an observation time of 40 min. The black lines represent the average, and the average ± standard error of the mean. Control (152 cells from 2 experiments) and nocodazole-treated (52 cells from 2 experiments) values are significantly different at p < 0.005 by Student’s t test (∗∗). (M) The directional auto-correlation (see STAR Methods) of nocodazole-treated cells. |
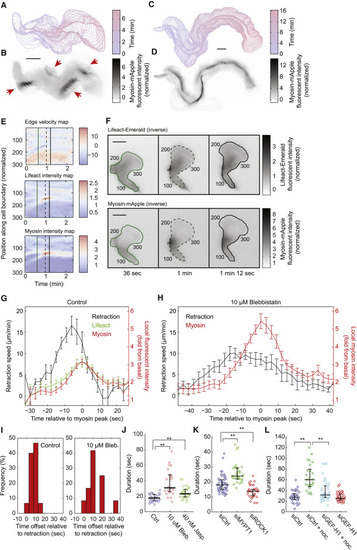
Myosin Contraction Mediates Rapid Flashes at the Cell Rear (A and C) Contours of a migrating HL60 cell over 400 s (A) and 970 s (C), with 10-s intervals. (B and D) Maximal intensity projection of inverse fluorescent images of MRLC-mApple from migrating cells in (A) and (C). The fluorescence intensity was normalized to the average intensity of the whole cell. (B) The red arrows highlight the spatial discontinuity of each myosin flash. The flashes are typically located at the outside of the turning trajectory. Scale bars in (A–D) and (F) are 10 μm. (E) Local edge velocity, local Lifeact-mEmerald intensity, and local MRLC-mApple intensity along the boundary of the cell over 138 s. In the edge velocity map, a positive velocity represents local protrusion and a negative velocity represents local retraction, with the unit of μm/min. In the local F-actin intensity map and the local myosin intensity map, the fluorescence intensity is normalized to the average of the cell. (F) Snapshots of inverse fluorescent images of Lifeact-mEmerald and MRLC-mApple during a flash. All the fluorescent images are inverted. The three time points correspond to the three vertical lines in (E). The number index along the cell contour corresponds to the number along the vertical axis in the three heatmaps in (E). (G and H) Average dynamics of the myosin flashes from control cells (G) (16 flashes from 3 cells) and blebbistatin-treated cells (H) (14 flashes from 4 cells). Error bars represent SEM. (I) Distribution of temporal offset between local myosin concentration and local retraction velocity in non-treated (15 flashes from 3 cells) and blebbistatin-treated (12 flashes from 4 cells) cells. A positive value means myosin dynamics lags behind retraction velocity. (J–L) Statistics of the duration of the myosin flashes under different conditions. Each open circle represents the average duration of a single cell observed for more than 10 min. Cell numbers: Control (30), blebbistatin (24), jasplakinolide (30) (J). siCtrl (46), siMYPT1 (36), siROCK1 (34) (K). siCtrl (33), siCtrl + nocodazole (25), siGEF-H1 + nocodazole (42), siGEF-H1 (42) (L). ∗∗ p < 0.005 (Student’s t test). |
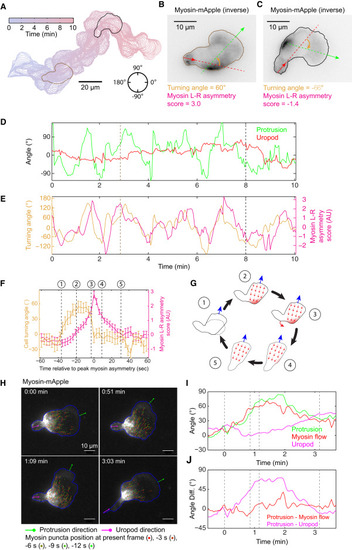
Asymmetric Myosin Localization Follows Directional Change of the Protrusion to Facilitate Efficient Turning (A) A 10-min trajectory of a frequently turning HL60 cell, with 3-s intervals. (B and C) Snapshots of inverse fluorescent images of MRLC-mApple at 2 min 51 s (B) and 8 min (C) as examples for cells turning left (B) or right (C). Green arrows represent the direction of protrusion, defined as the normal vector from the point at the leading edge with maximal protrusion speed. Red arrows represent the normal direction from the tip of the uropod. The turning angle of the cell is defined as the difference of the green and red arrows, shown in orange. In both cases, myosin localizes to the outside of the turn. (D) The direction of protrusion (green) and uropod (red) throughout the 10-min trajectory. The direction is defined in the circle in (A), with 0° pointing to the right and the angle increases counter-clockwise to 180°, and decreases clockwise to −180°. (E) Turning angle (orange) and myosin left-right asymmetry score (red) throughout the 10-min trajectory. The myosin asymmetry appears to lag behind the turning of the protrusion. (D and E) The brown and black dashed lines correspond to the image shown in (B) and (C), respectively. (F) Summary of the average turning dynamics and the corresponding myosin left-right asymmetry score from 46 turning events in 6 different cells. The signs of myosin asymmetry score and turning angle from a right turn are inversed to allow averaging with left turns. At each turn, the peak of myosin asymmetry is defined as time 0. The turning dynamics and myosin asymmetry score from −60 s to 60 s in all 46 turns are averaged. Error bars represent SEM. (G) Cartoon illustration of the temporal sequence during a turn. The numbers 1 to 5 correspond to the numbers 1 to 5 along the temporal axis in (F). (H) TIRF images of myosin flow in a turning HL60 cell. Green lines are the directions of protrusion. Magenta lines are the directions of the uropod. Blue lines outline the cell contours. Movement of individual myosin puncta in the cell frame of reference were shown for 5 consecutive frames and marked with different colors as described in the figure. (I and J) Myosin flow direction closely follows the protrusion direction, while the uropod lags behind during cell turning. The direction of protrusion (green), myosin flow (red) and uropod (magenta) in the lab frame of reference are shown in (I). The differences between protrusion direction and myosin flow (red) and between protrusion and uropod direction (magenta) are shown in (J). |
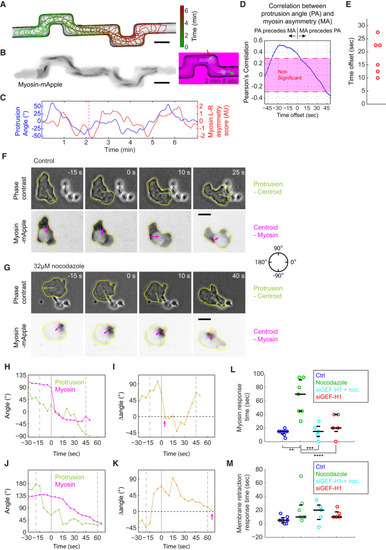
Rapid Myosin Dynamics Is Preserved in HL60 Cells Forced to Turn Mechanically and Facilitates Quick Re-orientation of the Rear during Chemotaxis (A) A 6.7-min trajectory of an HL60 cell migrating within a microfluidic channel, with 12.5-s intervals. Scale bars in (A), (B), (F), and (G) represent 10 μm. (B) A maximal intensity projection of the MRLC-mApple fluorescent images. The colored image at the right of the maximal intensity projection is a snapshot of the the cell when it is turning within the channel. Green arrow indicates the protrusion direction, while the red arrow highlights the myosin flash. (C) The dynamics of protrusion angle (blue) versus myosin left-right asymmetry score (red) reveal the correlation between the two parameters with some temporal offset. (D) Cross-correlation analysis between the protrusion angle and the myosin left-right asymmetry shown in (C) reveals maximal correlation at an offset of 27.5 s. (E) Summary of the temporal offset between protrusion angle and myosin left-right asymmetry in 6 distinct videos from 3 cells migrating in the microfluidic channel. Each video contains at least 3 90° turns. (F and G) Snapshots of phase contrast images and inverted MRLC-mApple fluorescent images from a control (F) or nocodazole-treated (G) HL60 cell migrating toward a C. albicans cell. The green arrows are the directions from the cell centroid to the point with the fastest protrusion velocity. The magenta arrows are the direction from the point with maximal myosin intensity to the cell centroid. (H and J) The temporal dynamics of protrusion direction and myosin contraction direction as the control (H) and nocodazole-treated (J) cell approaches the C. albicans cell. (I and K) The angular difference between the protrusion and myosin contraction direction as the control (I) and nocodazole-treated (K) cell approaches the fungal cell. The pink arrows represent the recorded myosin response time in (L). (H and K) The first dashed line represents the initiation of the turning event. The second solid line represents the time when the protrusion direction aligns with the C. albicans cell. The last dashed line represents the completion of phagocytosis. (L) The response time of myosin localization after the protrusion aligns with the Candida cell under different conditions. Response time of nocodazole-treated cells is significantly different from all other samples with p < 0.05 (∗) or p < 0.005 (∗∗) by Student’s t test. (M) The response time of membrane retraction after the protrusion aligns with the Candida cell under different conditions. (L and M) The three black lines are the 25th, 50th, and 75th percentile of the data. Sample sizes in the format of (number of cells, number of experiments) are control (7, 2), nocodazole (7, 4), siGEF-H1 + nocodazole (5, 2), and siGEF-H1 (5, 2). |
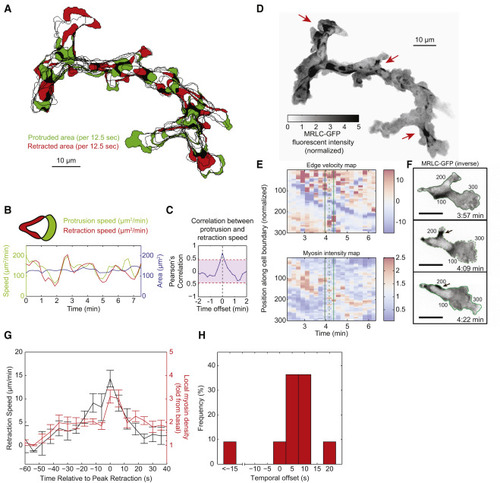
Efficient Front-Rear Coupling and Dynamic Myosin Localization in Migrating Neutrophils In Vivo (A) A 7-min trajectory of a migrating neutrophil in 3-day old zebrafish larvae with 12.5-s intervals. Newly protruded area (green) and newly retracted area (red) were calculated every 12.5 s. Only one third of the time points were colored with green or red for ease of visualization. (B) A 7-min trace of the protrusion speed (green), retraction speed (red) for the cell shown in (A). Total cell area over the same time frame is shown in blue. (C) Cross-correlation between the protrusion speed and the retraction speed for the same cell, showing maximal correlation at zero temporal offset. The magenta shaded region represents a correlation that is below the 95% confidence interval. (D) Maximal intensity projection of inverse fluorescent images of MRLC2-EGFP from migrating cells in (A). The red arrows highlight the spatial discontinuity of each myosin flash. Scale bars in (A) and (D) represent 10 μm. (E) Local edge velocity and local MRLC2-EGFP intensity along the cell boundary. In the edge velocity map, a positive velocity represents local protrusion and a negative velocity represents local retraction, with the unit of μm/min. In the local myosin intensity map, the fluorescence intensity is normalized to the lowest 10% of the cell. (F) Snapshots of MRLC2-EGFP fluorescent images during a flash. All the fluorescent images are inverted. The three time points correspond to the three vertical lines in (E). The number index along the cell contour corresponds to the number along the vertical axis in the heatmaps in (E). Scale bars are 10 μm. (G) Average dynamics of local edge retraction velocity and local myosin concentration. Error bars represent SEM. (H) Distribution of temporal offset between local myosin concentration and local retraction velocity. A positive value means myosin dynamics lags behind retraction velocity. |
Reprinted from Developmental Cell, 49, Tsai, T.Y., Collins, S.R., Chan, C.K., Hadjitheodorou, A., Lam, P.Y., Lou, S.S., Yang, H.W., Jorgensen, J., Ellett, F., Irimia, D., Davidson, M.W., Fischer, R.S., Huttenlocher, A., Meyer, T., Ferrell, J.E., Theriot, J.A., Efficient Front-Rear Coupling in Neutrophil Chemotaxis by Dynamic Myosin II Localization, 189-205.e6, Copyright (2019) with permission from Elsevier. Full text @ Dev. Cell