FIGURE SUMMARY
Title

Neuron-glia interaction through Serotonin-BDNF-NGFR axis enables regenerative neurogenesis in Alzheimer's model of adult zebrafish brain

Authors
Bhattarai, P., Cosacak, M.I., Mashkaryan, V., Demir, S., Popova, S.D., Govindarajan, N., Brandt, K., Zhang, Y., Chang, W., Ampatzis, K., Kizil, C.
Source
Full text @ PLoS Biol.

IL4 regulates tryptophan metabolism.

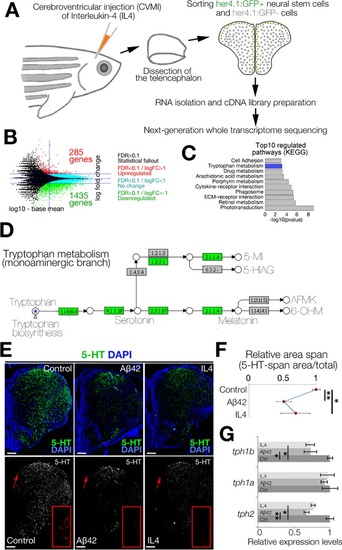
(A) Schematic view of the experimental pipeline for whole-transcriptome sequencing IL4 treatment. (B) MA-plot for DEGs. (C) GO-term analyses on DEGs. (D) Modified KEGG-pathway view of tryptophan metabolism. Green indicates the enzymes down-regulated by IL4. (E) IHC for 5-HT in control (left), Aβ42-injected (middle), and IL4-injected (right) brains. Single-channel images show 5-HT. Red insets are high-magnification images of arrowed regions. (Dm: dorsal-medial) (F) Quantification of 5-HT-span area density under the conditions of E. (G) qRT-PCR results for tph1a, tph1b, and tph2 in control, amyloid-injected, and IL4-injected zebrafish brains. Beta-actin used for normalization. n = 3 animals for experiments. Scale bars equal 100 μM. Data are represented as mean ± SEM. See also S1 Fig and S2 Fig. See S2 Data and S7 Data for supporting information. Aβ42, amyloid-beta42; DEG, differentially expressed gene; ECM, extracellular matrix; FC, fold change; FDR, false discovery rate; GFP, green fluorescent protein; GO, gene ontology; IHC, immunohistochemistry; KEGG, Kyoto Encyclopedia of Genes and Genomes; IL4, interleukin-4; MA, Bland-Altman mean-average plot; qRT-PCR, quantitative real-time polymerase chain reaction; 5-HT, serotonin.

Serotonin regulates NSC plasticity indirectly through HTR1 signaling in periventiruclar neurons.

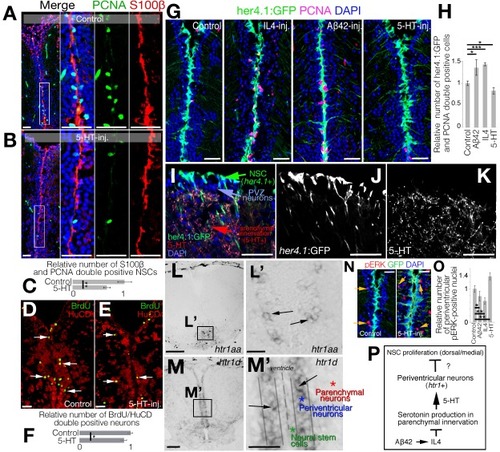
(A, B) IHC for S100β and PCNA in control (A) and 5-HT-injected (B) brains. (C) Quantification of proliferating glia in conditions of panels A and B. (D, E) IHC for BrdU and HuC/D for newborn neurons at 14 dpi after BrdU treatment at 2 and 3 dpi (D) and BDNF injection (E). (F) Quantification of newborn neurons. (G) IHC for GFP (driven by glial promoter her4.1) and PCNA in control, IL4-injected, Aβ42-injected, and 5-HT-injected brains. (H) Quantification of proliferating glia in conditions of panel G. (I-K) IHC for her4.1-driven GFP and 5-HT. The composite image (I) and single fluorescent channels for her4.1:GFP (J) and 5-HT (K). (L) ISH for htr1a (panel Lʹ: close-up image of framed region in panel L). (M) ISH for htr1d (panel Mʹ: close-up image of framed region in panel M). (N) IHC for pERK and her4.1-driven GFP in control and 5-HT-injected brains. (O) Quantification of pERK-positive periventricular neurons. (P) Working hypothesis on the indirect regulation of 5-HT on NSC plasticity. n = 4 animals for experiments. Scale bars equal 100 μM. Data are represented as mean ± SEM. See also S3 Fig. See S7 Data for supporting information. Aβ42, amyloid-beta42; BDNF, brain-derived neurotrophic factor; BrdU, 5-bromo-2'-deoxyuridine; dpi, days post injection; GFP, green fluorescent protein; HTR1, 5-hydroxytryptamine receptor 1; HuC/D, ELAV (embryonic lethal, abnormal vision, Drosophila)-like 3/4; IHC, immunohistochemistry; IL4, interleukin-4; ISH, in situ hybridization; NSC, neural stem cell; pERK,; phosphorylated extracellular signal-regulated kinase; PCNA, proliferating cell nuclear antigen; PVZ, periventricular zone; S100β, S100 calcium-binding protein B; 5-HT, serotonin.

Single-cell sequencing after serotonin treatment in the adult zebrafish brain and data analyses.

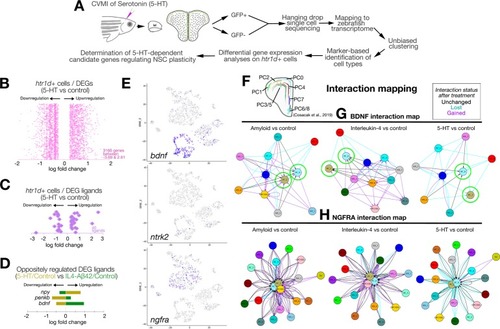
(A) Schematic workflow for single-cell sequencing and data analyses. (B) Distribution plot for DEGs in
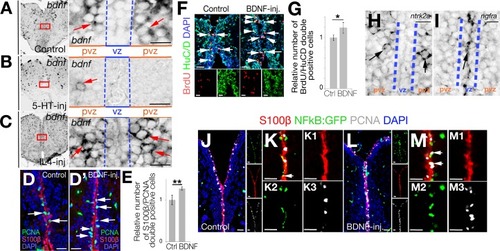
 htr1d-expressing cells after 5-HT treatment. (C) Ligands selected from panel B. (D) Plots for ligands that change oppositely in 5-HT and IL4/Aβ42 treatment. (E) Feature plots for bdnf and its receptors ntrk2 and ngfra. (F) Spatial map of NSCs/PCs in the adult zebrafish brain as previously described in Cosacak et al., 2019. (G) In silico interaction map for BDNF in amyloid versus control, IL4 versus control, and 5-HT versus control comparisons. (H) In silico interaction map for NGFRA in Aβ42 versus control, IL4 versus control, and 5-HT versus control comparisons. In panels G and H, black arrows: interactions unchanged with treatment, cyan arrows: interaction lost with treatment, magenta arrows: interaction gained/emerged with the treatment. See also S4 Fig and S5 Fig. See S3 Data and S4 Data for supporting information. Aβ42, amyloid-beta42; BDNF, brain-derived neurotrophic factor; CVMI, cerebroventricular microinjection; DEG, differentially expressed gene; GFP, green fluorescent protein; IL4, interleukin-4; NGFRA, nerve growth factor receptor A; NSC, neural stem cell; PC, progenitor cell; 5-HT, serotonin.

Serotonin regulates periventricular <italic>bdnf</italic> expression and NFkB signaling in NSCs.

(A–C) ISH for bdnf in control (A), 5-HT-injected (B), and IL4-injected (C) brains. Red rectangles are enlarged to the right of the main panels. Note significant reduction of bdnf expression after 5-HT. (D, Dʹ) IHC for PCNA and S100β in control (D) and BDNF-injected (Dʹ) brains. (E) Quantification of proliferating glial cells after BDNF injection. (F) IHC for BrdU and HuC/D in control and BDNF-injected brains. (G) Quantification of newborn neurons at 14 dpi after BrdU treatment at Day 2 and Day 3 after PBS and BDNF injection. (H) ISH for ntrk2, which is expressed in periventricular neurons but not in NSCs in the vz. (I) ISH for ngfra, which is expressed in vz. (J) IHC for S100β, NFkB-driven GFP, and PCNA in control brains. To the right of the larger panel are single-fluorescence channels. (K) High-magnification of the medial region of panel J without DAPI. (K1–K3) Single fluorescent channels of panel K. (L) IHC for S100β, NFkB-driven GFP, and PCNA in BDNF-injected brains. To the right of the larger panel are single-fluorescence channels. (M) High-magnification of the medial region of panel L without DAPI. (M1–M3) Single-fluorescence channels of panel M. Scale bars equal 100 μM. Data are represented as mean ± SEM. See also S4S10 Figs. See S7 Data for supporting information. BDNF, brain-derived neurotrophic factor; BrdU, 5-bromo-2'-deoxyuridine; dpi, days post injection; GFP, green fluorescent protein; HuC/D, ELAV (embryonic lethal, abnormal vision, Drosophila)-like 3/4; IHC, immunohistochemistry; IL4, interleukin-4; ISH, in situ hybridization; NFkB, nuclear factor 'kappa-light-chain-enhancer' of activated B-cells; NSC, neural stem cell; PCNA, proliferating nuclear cell antigen; pvz, periventricular zone; S100β, S100 calcium-binding protein B; vz, ventricular zone; 5-HT, serotonin.

EXPRESSION / LABELING:
Genes:
Fish:
Anatomical Terms:
Stage: Adult

Ngfra signaling regulates NSC plasticity independent of Il4ra signaling.

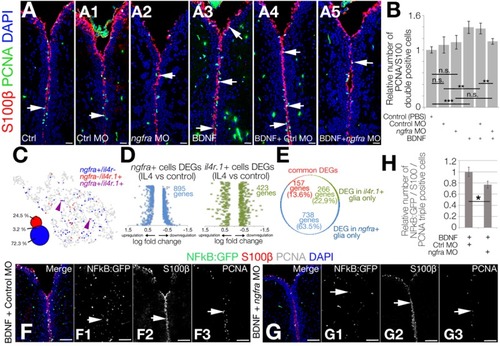
(A–A5) IHC for S100β and PCNA in control (A), control morpholino-injected (A1), ngfra morpholino-injected (A2), BDNF-injected (A3), BDNF + control morpholino-injected (A4), and BDNF + ngfra morpholino-injected (A5) brains. (B) Quantification for the relative number of proliferating glial cells. (C) Co-representation of ngfra and ilr4 expressions on glial tSNE plot. (D) DEG plots for ngfra-positive and il4r-positive neural stem cells after IL4 treatment. (E) Pie chart distribution of unique DEGs. Note that the overlapping genes constitute only 13.6% of all DEGs. (F, G) IHC for S100β, NFkB-driven GFP, and PCNA in BDNF + control morpholino-injected (F–F3) and BDNF + ngfra morpholino-injected brains (G–G3).(H) Quantification graph for relative numbers of proliferating stem cells with active NFkB signaling. Scale bars equal 100 μM. Data are represented as mean ± SEM. See also S10 Fig. See S5 Data, S6 Data, and S7 Data for supporting information. BDNF, brain-derived neurotrophic factor; DEG, differentially expressed gene; GFP, green fluorescent protein; IHC, immunohistochemistry; IL4, interleukin-4; NFkB, nuclear factor 'kappa-light-chain-enhancer' of activated B-cells; Ngfr, nerve growth factor receptor; NSC, neural stem cell; PCNA, proliferating nuclear cell antigen; S100β, S100 calcium-binding protein B; tSNE, t-Distributed Stochastic Neighbor Embedding.

Schematic view of the findings on how neuron-glia crosstalk regulates Alzheimer-induced neurogenesis in adult zebrafish brain.

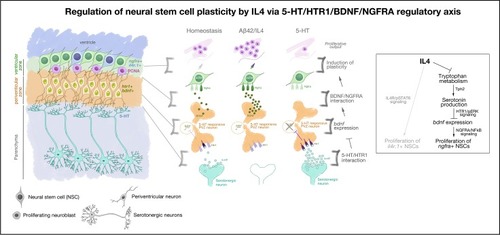
Aβ42, amyloid-beta42; bdnf, brain-derived neurotrophic factor; htr1, 5-hydroxytryptamine receptor 1; IL4, interleukin-4; NFkB, nuclear factor 'kappa-light-chain-enhancer' of activated B-cells; NGFRA, nerve growth factor receptor A; NSC, neural stem cell; PCNA, proliferating cell nuclear antigen; pERK, hosphorylated extracellular signal-regulated kinase; pSTAT6, phosphorylated signal transducer and activator of transcription 6, interleukin-4 induced; PVZ, periventricular zone; ngfra, nerve growth factor receptor A; Tph2, tryptophan hydroxylase; 5-HT, serotonin.

Acknowledgments
This image is the copyrighted work of the attributed author or publisher, and ZFIN has permission only to display this image to its users. Additional permissions should be obtained from the applicable author or publisher of the image. Full text @ PLoS Biol.