
- Title
-
Deconstructing Hunting Behavior Reveals a Tightly Coupled Stimulus-Response Loop
- Authors
- Mearns, D.S., Donovan, J.C., Fernandes, A.M., Semmelhack, J.L., Baier, H.
- Source
- Full text @ Curr. Biol.
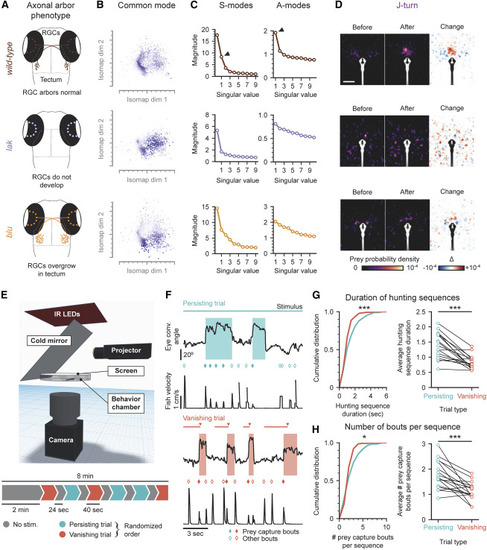
Chronic and Acute Disruption in Virtual Reality of Visual Cues Impairs Prey Capture (A–D) Behavioral dynamics in mutants. (A) Schematic anatomical phenotype of lakritz (lak) and blumenkohl (blu) mutants. (B) Common mode obtained from the SVD of transition matrices after mapping bouts from wild-type sibling control (top), lak (middle), and blu (bottom) animals into the behavioral space from Figure 1. (C) Singular values associated with S- and A-modes. Black arrowheads: prey capture-associated modes present in controls but absent or disrupted in mutants. (D) Stimulus maps associated with J-turns. (E–H) Acute disruption of visual cues during prey capture. (E) Setup and experimental design for a virtual prey capture assay. Animals are presented with six 40 s stimulus trials, interspersed with intervals with no stimuli. Persisting trials: virtual prey are always present. Vanishing trials: virtual prey disappear as soon as eye convergence is detected. (F) Example period from persisting (top) and vanishing (bottom) trials. Horizontal bars show when stimulus was present. Arrowheads indicate when eye convergence was detected online and the stimulus removed. Diamonds: automatic bout detection. Shaded regions: post hoc determination of eye convergence. (G) Left: cumulative distribution of hunt durations (∗∗∗p < 0.001, Kolmogorov-Smirnov test). Right: average prey capture sequence duration during persisting and vanishing trials (∗∗∗p < 0.001, Wilcoxon signed-rank test). (H) Left: cumulative distribution of bout chain lengths (∗p < 0.05, Kolmogorov-Smirnov test). Right: average number of bouts per hunting sequence (∗∗∗p < 0.001, Wilcoxon signed-rank test). See also Figures S5 and S6. PHENOTYPE:
|
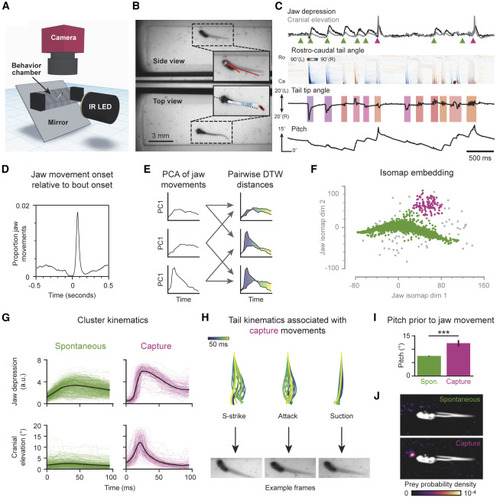
Larvae Capture Prey from Below with Stereotyped Jaw Kinematics (A) Schematic of the setup used to record behavior simultaneously from above and from the side. (B) Example frame; insets are overlaid with tail and jaw tracking. (C) Jaw and tail kinematics from 4 s of behavioral recording. Top: depression of the jaw (black) and elevation of the cranium (gray). Arrowheads: jaw movement onsets. Spontaneous movements (green); capture strikes (magenta). Middle: tail tracking. Bouts color-coded according to nearest exemplar in behavioral space. Bottom: pitch of the fish. (D) Cross-correlation between bout onsets and jaw movement onsets. (E) Generating a jaw movement behavioral space. Jaw movements projected onto first PC followed by pairwise alignment and distance calculation with DTW. (F) Two-dimensional isomap embedding of DTW distances between jaw movements. Clustered using HDBSCAN into spontaneous jaw movements (green), capture jaw movements (magenta), and noise (gray). (G) Jaw depression (top) and cranial elevation (bottom) for spontaneous (left) and capture (right) jaw movements. Colored traces: individual movements. Black lines: average. (H) Example tail movements (top) preceding the shown capture jaw movement (bottom). (I) Pitch of fish prior to bouts containing spontaneous and capture jaw movements (∗∗∗two-tailed p < 0.001, unpaired Student’s t test). Mean ± SEM. (J) Prey probability density prior to bouts containing spontaneous (top) and capture (bottom) jaw movements. White: average outline of fish. Anterior is left. See also Videos S6 and S7. |
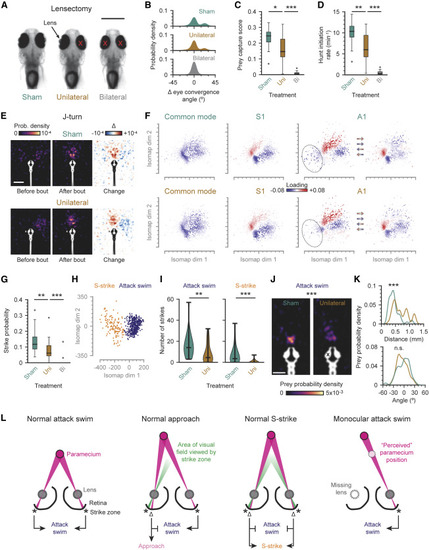
Larvae Use Binocular Cues to Position Prey on the Strike Zone (A) Lensectomy. Lens dissected from one (unilateral) or both (bilateral) eyes (red crosses). Scale bar, 500 μm. (B) Eye convergence distributions in sham, unilaterally, and bilaterally delensed larvae. Aligned to the resting eye convergence angle (0°). (C) Proportion of time spent engaged in prey capture (prey capture score) for each treatment group. (D) Number of times animals converged their eyes each minute (hunt initiation rate) for each treatment group. (E) Stimulus maps for sham and unilaterally delensed animals during J-turns. Animals that had their right lens removed are mirrored (white cross). Scale bar, 1 mm. (F) Transition modes of sham (top) and unilaterally delensed (bottom) animals. Differences between common modes not significant (p > 0.05). Differences between S1 and A1: p < 0.05, permutation test on absolute cosine similarity. Dotted outline: approximate location of capture strikes in the space. (G) Probability that hunting sequences terminate with a capture strike for animals in each treatment group. (H) Capture strike sub-space, generated as outlined in Figure 5B. Capture strikes clustered into two types using K-means clustering. Attack swims (blue). S-strikes (orange). (I) Number of strikes performed by animals split by strike type (attack swim versus S-strike) and treatment group (sham versus unilateral). (J) Prey probability density at the onset of attack swims in sham (left) and unilaterally delensed (right) animals. Cross indicates eye with lens removed (right animals mirrored). Scale bar, 500 μm. (K) Prey probability densities prior to attack swims at various distances (top) and azimuthal angles (bottom) in the visual field for sham and unilaterally delensed animals. Positive angles signify azimuthal position toward the sighted eye. (L) Model for the binocular control of capture strikes. Far left: a paramecium falling on the strike zone triggers an attack swim. Center left: a paramecium falling outside the strike zone triggers an approach. Center right: a paramecium centered in the visual field but outside the strike zone triggers an S-strike. Far right: a paramecium falling outside the strike zone in a larva with its left lens removed (gray dotted outline) triggers an inappropriate attack swim. Δ signifies offset between current prey position (magenta) and strike zone (asterisk/green cone). (C), (D), (G), and (I): ∗p < 0.05, ∗∗p < 0.01, ∗∗∗p < 0.001; Mann-Whitney U test. (J) and (K): ∗∗∗p < 0.001; n.s., not significant (p = 0.15), permutation test on energy distances between distributions. See also Video S8. PHENOTYPE:
|

ZFIN is incorporating published figure images and captions as part of an ongoing project. Figures from some publications have not yet been curated, or are not available for display because of copyright restrictions. PHENOTYPE:
|