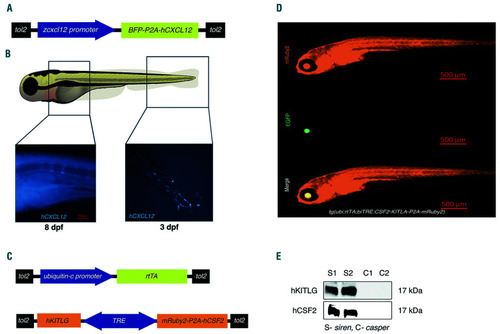
Humanized transgenic zebrafish express human CXCL12, KITLG, and CSF2. Transgenic zebrafish expressing human cytokines were generated by co-injecting tol2 mRNA and plasmids (A and C). (A) A cartoon of the construct used to make the transgenic zebrafish expressing human CXCL12 (hCXCL12) along with tagBFP under the zebrafish cxcl12 promoter. (B) Representative image of a transgenic zebrafish expressing human CXCL12 in the posterior hemal arc near the tip of the tail at 3 days post-fertilization (dpf). CXCL12 expression continues to progress anteriorly through the hemal arc (representative image shows 8 dpf larvae). (C) A cartoon of the constructs used to make the tet-inducible human SCF/KITLG and GM-CSF/CSF2 expressing zebrafish. (D) Representative image of the human SCF/KITLG (hKITLG) and GM-CSF/CSF2 (hCSF2)-expressing zebrafish. Image specification: magnification = 5x, numerical aperture = 0.16. (E) Representative western blot showing expression of human GM-CSF/CSF2 (hCSF2) and SCF/KITLG (hKITLG) in transgenic zebrafish. S1 and S2 denote samples from the transgenic larvae, and C1 and C2 are samples from control casper larvae. SCF/KITLG: stem cell factor/KIT ligand; GM-CSF/CSF2: granulocyte-monocyte colony- stimulating factor/colony-stimulating factor 2.
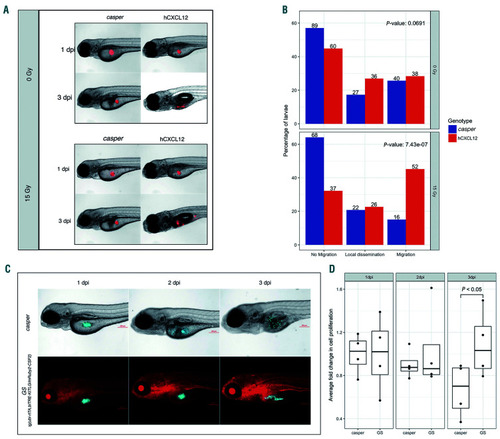
Irradiation of human CXCL12-expressing transgenic zebrafish dramatically increases cell migration, while myeloid leukemia cells exhibit enhanced proliferation in the presence of CSF2/GM-CSF and KITLG/SCF. (A) Human Jurkat cells (which highly express CXCR4, the receptor for CXCL12) were xenografted into control casper and CXCL12-expressing larvae, which were further divided into two groups: one which received 15 Gy irradiation and the other no irradiation at 72 hours postfertilization (hpf). Larvae were screened for cell migration at 144 hpf. Representative images of control and CXCL12-expressing larvae that were not irradiated uooer panel). Representative images of control and CXCL12-expressing larvae following 15 Gy gamma irradiation (lower panel). (B) Quantification of cell migration was classified into “no migration,” “local dissemination” (dissemination within the yolk sac) and “migration” (distant migration beyond the yolk sac). Results represent three independent experiments. Numbers on the bar denote the total number of larvae per classification. (C) Representative images of zebrafish injected with CMK cells, a myeloid leukemia of Down syndrome (ML-DS) cell line. (D) Cell proliferation was quantified in transgenic larvae expressing GM-CSF/CSF2 and SCF/KITLG (GS fish) and casper controls following enzymatic digestion and dissociation at 1 day post-injection (dpi) (baseline), 2 dpi and 3 dpi. The analysis included fluorescence microscopy and cell counting. At 2 dpi there was a slight decrease in cell numbers in both transgenic and control larvae. By 3 dpi there was an increase in cell numbers in GS larvae, whereas cell numbers in control larvae decreased. Data presented represents four replicates with each dot in the bar graph denoting a single replicate. SCF/KITLG: stem cell factor/KIT ligand; GM-CSF/CSF2: granulocyte-monocyte colony-stimulating factor/colony-stimulating factor 2.
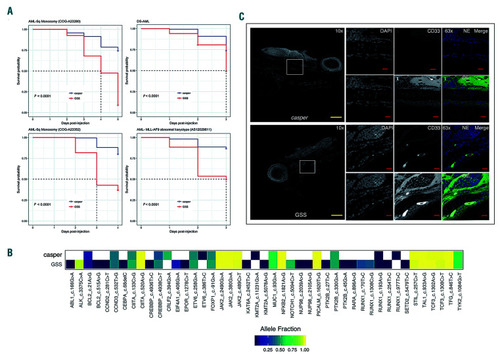
Patient-derived acute myeloid leukemia transplantation into GSS transgenic larvae increases leukemia-related disease mortality and shows increased clonal representation in comparison to control larvae. (A) Kaplan-Meier curve showing increased acute myeloid leukemia (AML)-related mortality in GSS larvae transplanted with each of four different patient-derived AML samples compared with casper control larvae transplanted with the same samples (P<0.0001). (B) Heatmap showing increased clonal representation in the GSS larvae compared to control larvae transplanted with the same sample as measured by RNA-error corrected sequencing. Different colors represent allele frequency from 0.002 (dark blue) to 1 (yellow). The white box represents an absence or allele frequency of less than 0.002. (C) Representative immunofluorescence images from sagittal zebrafish sections showing human CD33+ AML cells localized in the kidney marrow of the GSS transgenic fish. The left panel shows an overview of the fish section at 10x, and the white box highlights the region of interest. The top three right panels show images taken under normal exposure based on controls and the overexposed image shown in the middle of the lower three panels illustrates the kidney morphology. The parameters were kept constant between GSS and control sections during imaging (N=5). The yellow scale bar is equivalent to 100 μm, and the red scale bar is equivalent to 10 μm. The top panel shows images from kidney marrow of control larvae injected with human AML samples, where leukemia cells are not present, and the bottom shows GSS larvae with human CD33+ AML cells. Image specifications: 10x images: numerical aperture (NA) = 0.45; 63x images: NA = 1.4, Zoom = 1.5. GM-CSF/CSF: granulocyte-monocyte colony-stimulating factor/colony-stimulating factor; SCF/KITLG: stem cell factor/KIT ligand; CXCL12/ SDF1α:CXCL12/stromal cell derived factor 1α; GSS: GM-CSF/CSF, SCF/KITLG, CXCL12/SDF1α-expressing transgenic zebrafish.
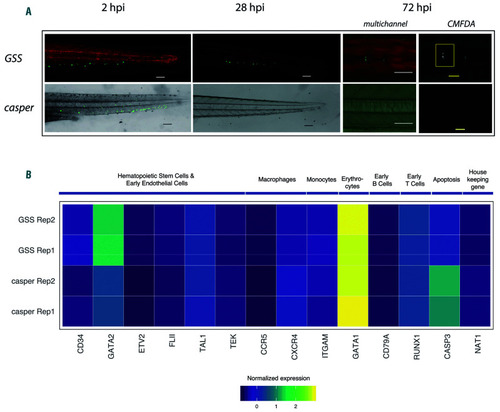
Umbilical cord blood-derived hematopoietic stem and progenitor cells show engraftment, self-renewal and multilineage differentiation in GSS larvae. (A) Representative image of GSS larvae and casper control larvae transplanted with umbilical cord blood (UCB)-derived hematopoietic stem and progenitor cells (HSPC). Image shows near complete absence of HSPC in control larvae at 28 hours post-injection (hpi), whereas the HSPC continue to survive in the GSS larvae at 28 hpi and HSPC are seen until 72 hpi (N=20/genotype). Image specification: magnification =10x, numerical aperture = 0.3. White and black scale bars represent 100 μm and the yellow scale bar represents 50 μm. (B) Heatmap from RNA sequencing analysis of transplanted HSPC shows the increased expression level of self-renewal specific genes in HSPC transplanted into GSS larvae. Control and GSS larvae showed an identical expression of different lineage-specific genes. GM-CSF/CSF: granulocyte-monocyte colony-stimulating factor/colony-stimulating factor; SCF/KITLG: stem cell factor/KIT ligand; CXCL12/ SDF1α:CXCL12/stromal cell derived factor 1α; GSS: GM-CSF/CSF, SCF/KITLG, CXCL12/SDF1α−expressing transgenic zebrafish.
Acknowledgments
This image is the copyrighted work of the attributed author or publisher, and
ZFIN has permission only to display this image to its users.
Additional permissions should be obtained from the applicable author or publisher of the image.
Full text @ Haematologica
Your Input Welcome
Thank you for submitting comments. Your input has been emailed to ZFIN curators who may contact you if
additional information is required.
Oops. Something went wrong. Please try again later.