FIGURE SUMMARY
Title

The Zebrafish Xenograft Platform-A Novel Tool for Modeling KSHV-Associated Diseases

Authors
Pringle, E.S., Wertman, J., Melong, N., Coombs, A.J., Young, A.L., O'Leary, D., Veinotte, C., Robinson, C.A., Ha, M.N., Dellaire, G., Druley, T.E., McCormick, C., Berman, J.N.
Source
Full text @ Viruses

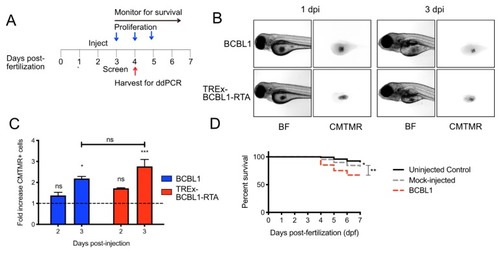
Proliferation of BCBL and TREx-BCBL1-RTA in zebrafish larvae: (A) timeline of xenotransplantation experiment. Fish were xenotransplanted with fluorescent CMTMR-labeled, primary effusion lymphoma cells by microinjection at 2 days post-fertilization (dpf). The following day, embryos were visually screened with a fluorescent microscope for viability and the presence of a cell bolus in the yolk sac. Groups of larvae were sacrificed at indicated times for dissociation and counting of xenotransplanted cells or RNA harvest. Survival of the larvae was monitored throughout the experiment; (B) photomicrographs of xenotransplanted larvae demonstrating the bolus of cells in the yolk sac at 1 and 3 days post-injection (dpi), which are 3 and 5 dpf, respectively; (C) proliferation of BCBL1 and TREx-BCBL1-RTA cells at 2 and 3 dpi normalized to the number of cells counted at 1 dpi (n = 3 independent experiments with cells from 20 larvae counted per measurement; means ± SEM; statistical significance was determined by two-way ANOVA compared to the cell counts at 1 dpf); (D) CMTMR-labeled BCBL1 cells were injected into 2 dpf embryos, which were screened at 3 dpi. Then survival was monitored until 7 dpf. Uninjected and media mock-injected embryos were included as controls (n = 150 larvae per group accrued from 3 separate hatchings; statistical significance was determined by Mantel-Cox test; * = p < 0.05, ** = p < 0.01, *** = p < 0.001).

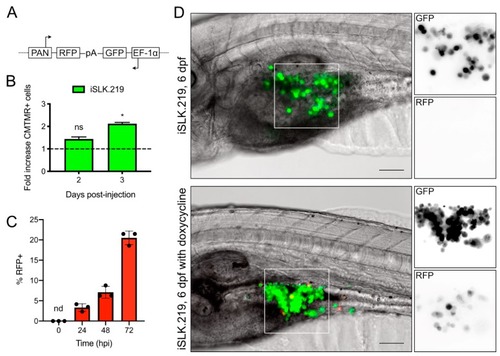
Proliferation and lytic reactivation of iSLK.219 in zebrafish embryos: (A) simplified diagram of rKSHV.219 reporter construct, adapted from [17,19]. Latently infected cells express GFP from a constitutive EF-1α promoter. During lytic replication, the immediate early protein RTA binds to the viral PAN promoter and stimulates RFP expression. A polyA (pA) signal sequence is present on both strands of the viral genome; (B) proliferation of iSLK.219 cells at 2 and 3 dpi, normalized to the number of cells counted at 1 dpi (n = 3 independent experiments with cells from 20 larvae counted per measurement; means ± SEM; statistical significance was determined by two-way ANOVA compared to the cell counts at 1 dpf; * = p < 0.05); (C) iSLK.219 cells were treated with 1 µg/mL of doxycycline and fixed at the times indicated, or left untreated (Time = 0 hpi). Cells were fixed with 4% paraformaldehyde, and nuclei were stained with Hoescht. RFP+ cells and nuclei were imaged on an inverted fluorescent microscope and enumerated with CellProfiler (n = 3 independent experiments ± SD; nd = not detected). (D) iSLK.219 were injected into the yolk sac of 2 dpf zebrafish embryos. The following days, larvae were screened for viability and a GFP+ cell bolus by fluorescence microscopy. In half of the larvae, the E3 media was supplemented with 40 µg/mL doxycycline, which was refreshed daily. Xenotransplanted larvae were monitored daily for RFP+ cells. Presented here are representative images of both doxycycline-activated and mock-treated larvae at the ethical endpoint of the experiment. We could observe RFP+ cells in the yolk sac of approximately 20% of larvae treated with doxycycline, and none in untreated larvae (scale bar = 100 µm).

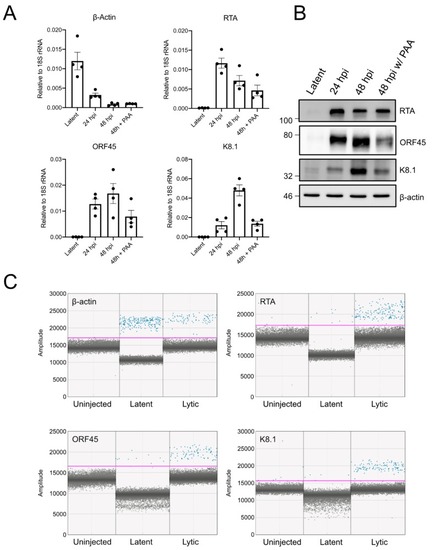
Detection of viral gene expression in xenotransplanted cells by ddPCR: (A) TREx-BCBL1-RTA cells reactivated with 1 µg/mL of doxycycline in culture and RNA was harvested at latent cells, or cells undergoing lytic replication at 24 or 48 h post-induction (hpi). Then, 500 µM phosphonoacetic acid (PAA) was used to inhibit replication of the viral genome and late gene expression; RT-qPCR was used to measure transcript abundance of β-actin, RTA (immediate early), ORF45 (early) and K8.1 (late) (n = 4 independent experiments; means ± SEM); (B) Western blot of cells treated as in (A) to confirm accumulation of target proteins; (C) ddPCR amplification plot for β-actin, RTA, ORF45, and K8.1. The x axis displays individual events, and the y axis is fluorescence amplitude. For all targets, we tested cDNA generated from uninjected larvae, or larvae injected with untreated TREx-BCBL1-RTA cells or cells treated with 1 µg/mL doxycycline for 12 h prior to injection. RNA was harvested from larvae at 48 hpi. The pink threshold line separates positive reaction droplets (blue) from negative droplets (gray).

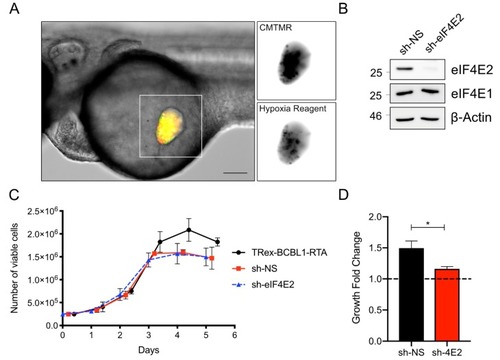
The zebrafish yolk sac is hypoxic and xenotransplant proliferation requires eIF4E2: (A) TREx-BCBL1-RTA cells were labeled with 1 µM of Image-iT Green Hypoxia Reagent for 30 min prior to washing and labeling with CMTMR dye. Cells were injected into 2 dpf embryos and imaged 1 hour later. Scale bar = 100 µm. (B) TREx-BCBL1-RTA cells were transduced with eIF4E2 shRNA or a non-targeting control lentivirus. Cells were harvested and probed for eIF4E2 and homologue eIF4E1 by Western blotting; (C) TREx-BCBL1-RTA cells or cells transduced as in (B) were seeded at 2.5 × 10⁵ cells/mL and monitored for viability and proliferation by manual counting, using a hemocytometer and trypan blue for the following five days (n = 3 independent transductions; means ± SEM; statistical significance was determined by two-way ANOVA); (D) proliferation of transduced TREx-BCBL1-RTA cells at 3 dpi normalized to the number of cells counted at 1 dpi (n = 3 independent experiments with cells from 20 larvae counted per measurement; means ± SEM; statistical significance was determined by two-way ANOVA compared to the cell counts at 1 dpf; * = p-value < 0.05).

Acknowledgments
This image is the copyrighted work of the attributed author or publisher, and ZFIN has permission only to display this image to its users. Additional permissions should be obtained from the applicable author or publisher of the image. Full text @ Viruses