
- Title
-
Omics-based Investigation of Diet-induced Obesity Synergized with HBx, Src, and p53 Mutation Accelerating Hepatocarcinogenesis in Zebrafish Model
- Authors
- Yang, W.Y., Rao, P.S., Luo, Y.C., Lin, H.K., Huang, S.H., Yang, J.M., Yuh, A.C.
- Source
- Full text @ Cancers

ZFIN is incorporating published figure images and captions as part of an ongoing project. Figures from some publications have not yet been curated, or are not available for display because of copyright restrictions. PHENOTYPE:
|
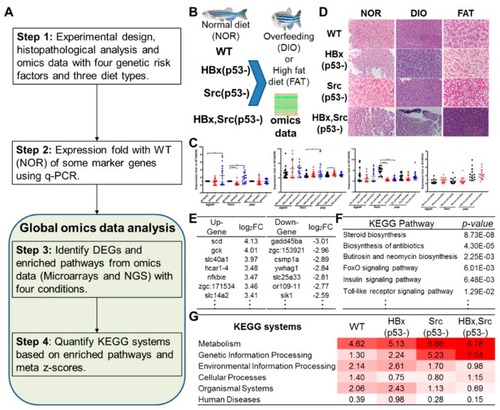
Overview of omics-based investigation of hepatocarcinogenesis in zebrafish models. ( |
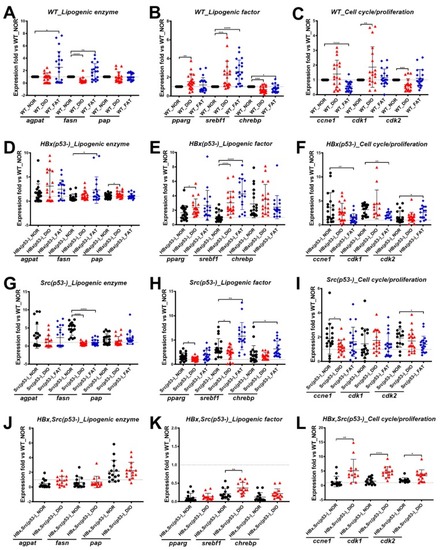
Expression of selected markers in various genetic background zebrafish fed with different diets. Expression of lipogenic enzymes ( |
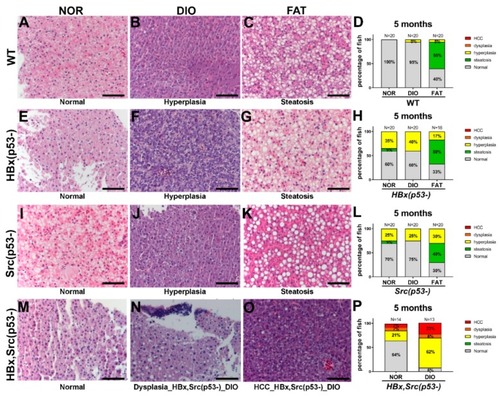
Histopathological changes in various genetic background zebrafish fed with different diets. Representative H&E stain images and histopathologic change statistics of ( PHENOTYPE:
|
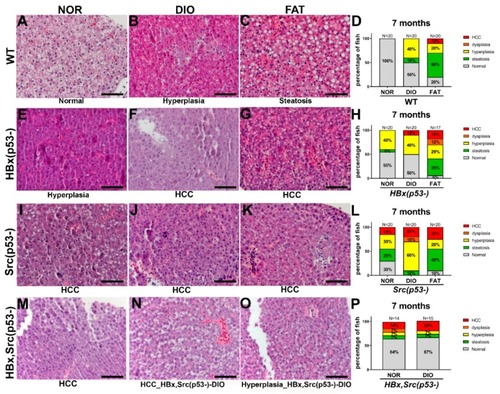
Histopathological changes in various genetic background zebrafish fed with different diets. Representative H&E stain images and histopathologic change statistics of ( PHENOTYPE:
|
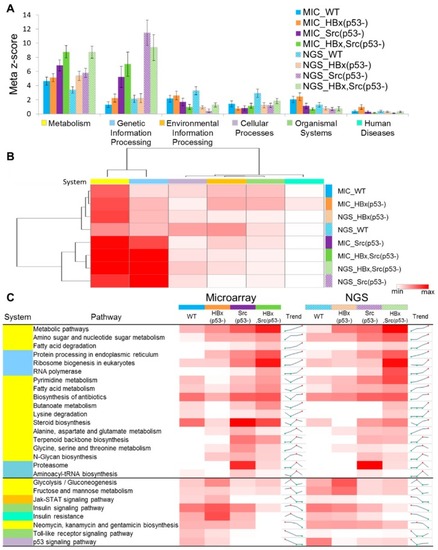
Statistics of system-level meta-z-scores and pathway z-scores for the four genetic fish models. ( |

Precision comparison of three scoring methods for obesity and HCC. Scoring methods for selecting potential genes are maximum combined score (MCS, red), average root combined score (ARCS, orange), and fold change (FC, blue) for ( |
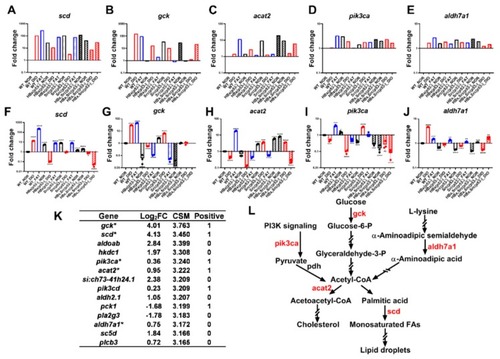
Validation of microarray with qPCR for the representative genes. Expression of ( |