FIGURE SUMMARY
Title

Characterizing renal involvement in Hermansky-Pudlak Syndrome in a zebrafish model

Authors
Schenk, H., Müller-Deile, J., Schroder, P., Bolaños-Palmieri, P., Beverly-Staggs, L., White, R., Bräsen, J.H., Haller, H., Schiffer, M.
Source
Full text @ Sci. Rep.

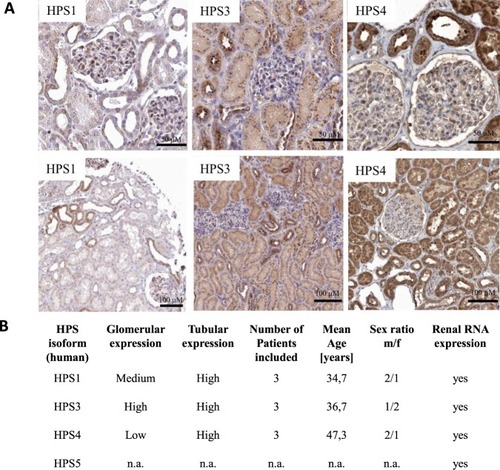
Cellular expression of HPS proteins was analyzed by immunohistochemistry in human kidney sections. (A) Localization of HPS 1 expression in glomeruli was present at a medium level, while high expression of HPS1 was prevalent in tubuli (https://www.proteinatlas.org/ENSG00000107521-HPS1/tissue/kidney). Expression of HPS3 in glomeruli was high, while a dominant expression in tubuli was detected (https://www.proteinatlas.org/ENSG00000163755-HPS3/tissue/kidney). HPS4 showed only minor expression in glomeruli, however, strong expression in tubuli was present (https://www.proteinatlas.org/ENSG00000100099-HPS4/tissue/kidney). No data on HPS5 protein expression can be accessed through Protein Atlas (https://www.proteinatlas.org/ENSG00000110756-HPS5/tissue/kidney). All described data were obtained using Protein Atlas Version 18. (B) Data on presence of HPS protein subtypes in human kidney sections. Data on HPS expression pattern is pooled from three kidney sections each. Furthermore, the number of patients included, the mean age, sex ratio and the renal RNA expression are stated.

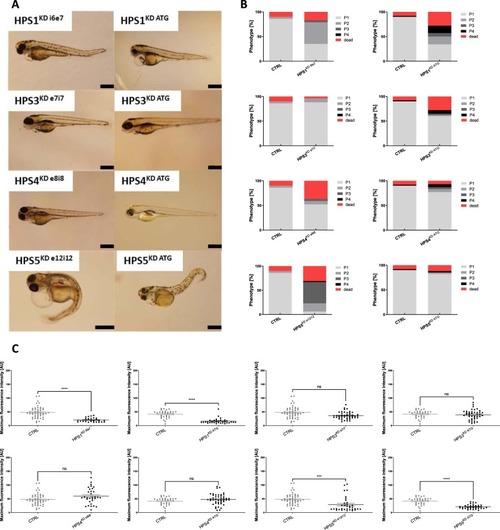
Phenotype evaluation and renal protein loss determination after induction of HPS1KD, HPS3KD, HPS4KD and HPS5KD in zebrafish. (A) The larval phenotype was analyzed at 96 hpf following HPSKD at the 1–2 cell stage. Both HPS1KD i6e7 and HPS1KD ATG larvae showed pericardial effusion and yolk sac edema and a slight curvature of the tail. HPS3KD e7i7 and similarly HPS3KD ATG embryos revealed mild pericardial effusion without yolk sac edema and a straight tail. A similar effect of the knockdown was detected in both the HPS4KD e8i8 and HPS4KD ATG groups which showed no pericardial effusion, yolk sac edema while a straight tail occurred. The HPS5KD e12i12 led to the most severe pericardial effusion, yolk sac edema and tail curvature, and the HPS5KD ATG caused a milder degree of pericardial effusion, yolk sac edema but a tail curvature, while CTRL-MO injected larvae showed no signs of an abnormal phenotype. Scale bar = 500 µm. (B) Phenotypic changes, indicating glomerular filtration barrier impairment, were determined by grading each larva at 96 hpf in terms of severity of pericardial effusion and yolk sac edema. Applying this grading system, a physiological appearance was scored as a P1 while the most severe edema and pericardial effusion was scored as P4. The number of dead larvae at 96 hpf is also stated. Both HPS1KD i6e7 and HPS1KD ATG resulted in either death or aberrance from the normal P1 condition in more than 50%, while a P2 phenotype in HPS1KD i6e7 and the P1 was in HPS5KD ATG were the most prominent. HPS3KD e7i7 did not show phenotypic changes in comparison with the control group, while the HPS3KD ATG showed a higher death rate but only mild to severe aberration in a minority of the larvae in comparison with the control group. In both HPS3KD e7i7 and HPS3KD ATG larvae, a P1 phenotype was the most common. The HPS4KD e8i8 induced a higher death rate but only mild aberration in some larvae from the normal phenotype in comparison with the control group. The HPS4KD ATG showed a similar death rate compared to the control while only the minority of larvae displayed a varying degree of aberration. HPS5KD e12i12 resulted in either death or deviated from the normal P1 condition in more than 50% of the cases, the P3 was in HPS5KD e12i12 the most prominent phenotype. The HPS5KD ATG showed overall similar results as the control group. (C) Quantification of maximum fluorescence intensity in the retinal vessel plexus of a Tg(l-fabp:eGFP-DBP) transgene zebrafish line depicted in arbitrary units (AU). Scatterplot presenting maximum fluorescence intensity of the fish eye was analyzed with ImageJ. All HPSKD groups were compared with the CTRL-MO injected group. HPS1KD i6e7, HPS1KD ATG, HPS5KD e12i12 and HPS5KD ATG led to a decrease of fluorescence intensity, while HPS3KD e7i7, HPS3KD ATG, HPS4KD e8i8 and HPS4KD ATG did not induce a reduction of fluorescence intensity. At least 26 animals were measured for each condition. The error bars indicate the mean ± SEM. n.s. = p ≥ 0.05, ***p ≤ 0.001, ****p ≤ 0.0001 by one-way ANOVA followed by Tukey’s multiple comparisons test.

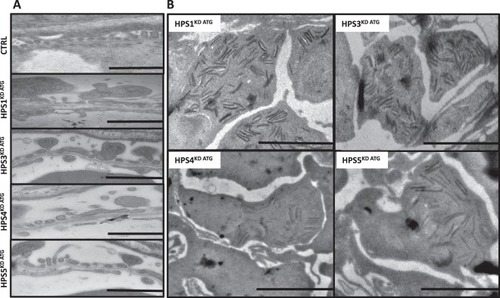
HPS1KD ATG, HPS3KD ATG, HPS4KD ATG and HPS5KD ATG induce varying degrees of glomerular damage including podocyte effacement and deposition of intracellular debris (zebra bodies). Transmission electron microscopy imaging was used to detect ultrastructural changes in glomeruli after HPS protein knockdown induced by MO injection in Tg(l-fabp:eGFP-DBP) transgene zebrafish embryos at a one to four cell stage. Collection of larvae for imaging was done at 120 hpf. (A) HPS1KD ATG causes loss of glomerular endothelial fenestration and podocyte effacement. HPS3KD ATG induces mild podocyte effacement. HPS4KD ATG causes podocyte effacement without endothelial injury, while HPS5KD ATG leads to reduced endothelial fenestration and podocyte effacement. Zebrafish injected with a control morpholino (CTRL-MO) show no sign of glomerular damage. Scale bar = 2 µm. (B) Induction of HPS protein knockdown of HPS1, -3, -4 and -5 leads to the deposition of intracellular debris primarily in podocytes. Scale bar = 500 nm.

ZFIN is incorporating published figure images and captions as part of an ongoing project. Figures from some publications have not yet been curated, or are not available for display because of copyright restrictions.

ZFIN is incorporating published figure images and captions as part of an ongoing project. Figures from some publications have not yet been curated, or are not available for display because of copyright restrictions.

Acknowledgments
This image is the copyrighted work of the attributed author or publisher, and ZFIN has permission only to display this image to its users. Additional permissions should be obtained from the applicable author or publisher of the image. Full text @ Sci. Rep.