
- Title
-
MicroRNA26 attenuates vascular smooth muscle maturation via endothelial BMP signalling
- Authors
- Watterston, C., Zeng, L., Onabadejo, A., Childs, S.J.
- Source
- Full text @ PLoS Genet.
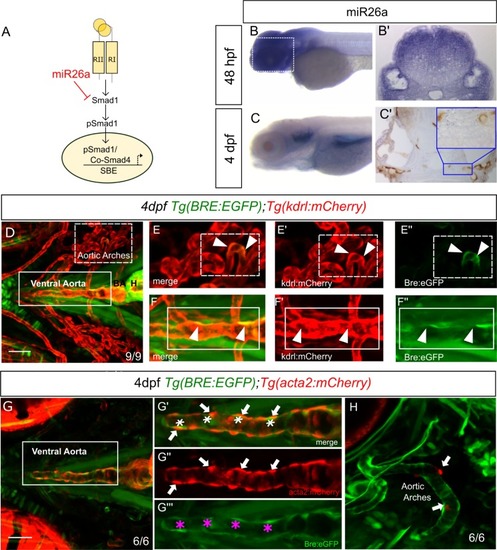
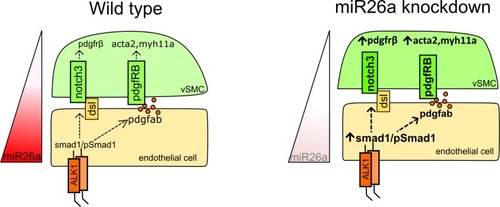
A) Model of how EXPRESSION / LABELING:
|
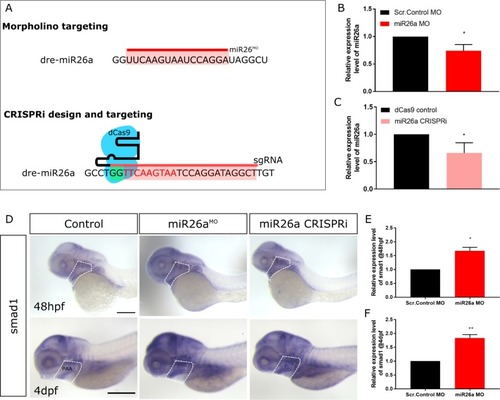
A) Schematic of |

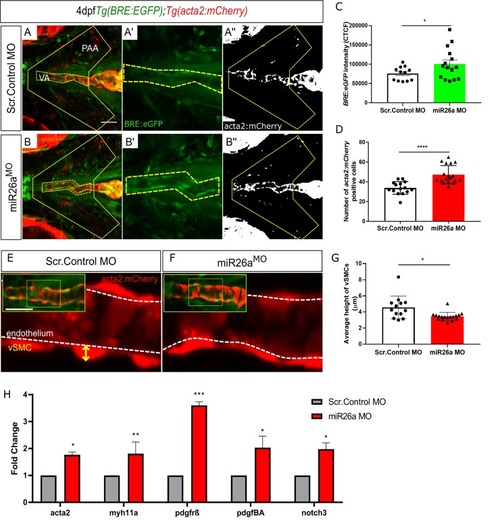
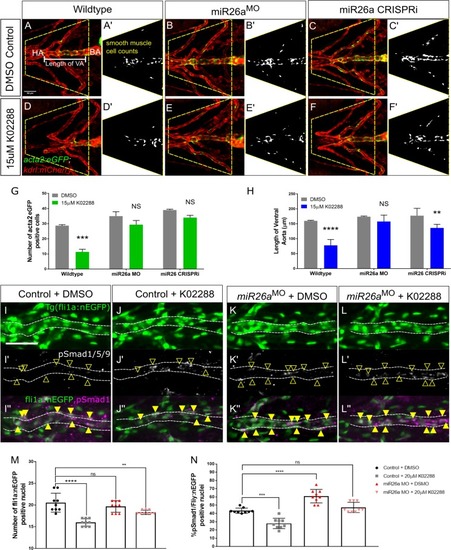
A-D) Ventral view confocal projections of the 4 dpf ventral aorta (dotted outline). Endothelial nuclei ( |
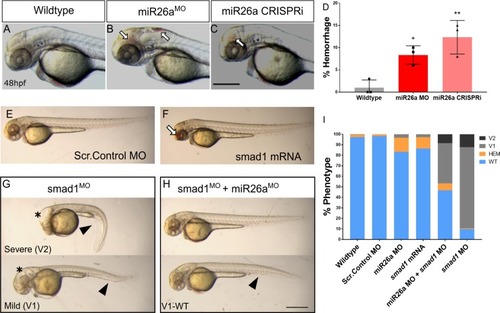
A-C) Representative 48 hpf PHENOTYPE:
|
A-B) Representative ventral views of 4 dpf |
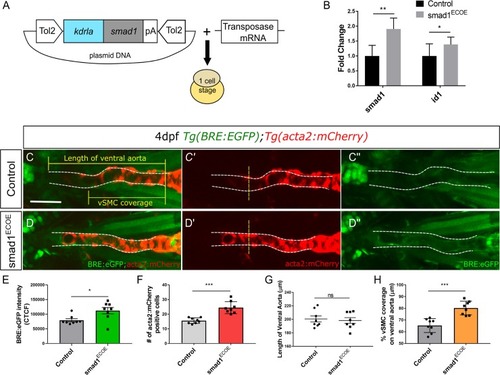
A) Vector construct for overexpression of PHENOTYPE:
|
Ventral aorta showing endothelial (red) and smooth muscle (green) cells in |
|

ZFIN is incorporating published figure images and captions as part of an ongoing project. Figures from some publications have not yet been curated, or are not available for display because of copyright restrictions. EXPRESSION / LABELING:
|
|
ZFIN is incorporating published figure images and captions as part of an ongoing project. Figures from some publications have not yet been curated, or are not available for display because of copyright restrictions. |
|
ZFIN is incorporating published figure images and captions as part of an ongoing project. Figures from some publications have not yet been curated, or are not available for display because of copyright restrictions. |