
- Title
-
CNS myelin protein 36K regulates oligodendrocyte differentiation through Notch
- Authors
- Nagarajan, B., Harder, A., Japp, A., Häberlein, F., Mingardo, E., Kleinert, H., Yilmaz, Ö., Zoons, A., Rau, B., Christ, A., Kubitscheck, U., Eiberger, B., Sandhoff, R., Eckhardt, M., Hartmann, D., Odermatt, B.
- Source
- Full text @ Glia
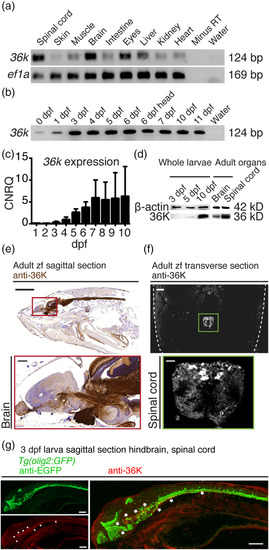
36K is mainly expressed in zebrafish CNS. (a) Exon‐exon junction spanning rt‐PCR showing expression of 36K in different organs of adult zebrafish, with ef1a as positive control. (b) rt‐PCR showing 36K expression in zfl during development. Whole larvae were used to prepare RNA at different dpf. At 6 dpf, additionally, the complete head region was separately taken for RT PCR depicted as 6 dpf head (Lane 7). (c) Quantitative rt‐PCR analysis of 36K expression during zfl development normalized to β‐actin and ef1a depicting calibrated normalized relative quantities (CNRQ) indicated an increase in 36K transcript expression from 3 dpf. (d) Western blot against 36K with whole larvae at different developmental stages, adult brain and spinal cord with β‐actin as loading control accordingly. (e) Anti‐36K staining in sagittal paraffin section from adult zebrafish showing specific expression in brain and spinal cord. Sections were counter stained with hematoxylin. Scale bar: 2 mm. The red inlay zooms in to show specific expression in brain. Scale bar: 200 μm. (f) Anti‐36K fluorescent staining in transverse paraffin section from adult zebrafish showing specific expression in spinal cord. Dashed lines depict fish skin. Scale bar: 200 μm. The green inlay zooms onto anti‐36K fluorescent staining in the spinal cord. Scale bar: 40 μm. (g) Anti‐36K (red) and anti‐EGFP (green) fluorescent staining in sagittal paraffin section from 3 dpf Tg(olig2:GFP) zfl hindbrain and spinal cord. A merge of the two labels is shown on the right, where the asterisk marks co‐localization (in yellow) of the olig2‐GFP and 36K protein expression in the myelin fibers of the spinal cord. Scale bar: 200 μm |
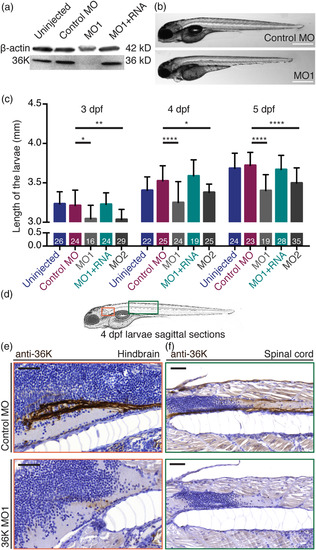
Translation blocking MOs specifically knock down 36K protein expression. (a) Anti‐36K Western blot on whole larvae tissue showing 36K MO1 knockdown and rescue at 4 dpf. (b) Lateral view of control MO and MO1 injected zfl at 4 dpf. Scale bars: 500 μm. (c) Reduction in body length of the MO larvae at 3, 4, and 5 dpf. Sample sizes: N = 3; n shown in each bar. Two way ANOVA p ≤ .0001 (****) followed by Tukey's multiple comparisons test for control MO versus MO1 and control MO versus MO2. MO1 versus MO1 + RNA was always significantly different (not shown). Control MO versus MO1 + RNA was not significant at any of the three time‐points (p > .05). (d) Zebrafish overview sketch highlighting different CNS regions: shown as red box (e, hindbrain) and as green box (f, spinal cord). (e,f) Comparable sagittal paraffin sections counter stained with hematoxylin depicting anti‐36K staining in the hindbrain (e) and spinal cord (f) at 4 dpf in control MO (top; intense staining) and MO1 (bottom; reduced/weak staining) zfl. Scale bars: 50 μm EXPRESSION / LABELING:
PHENOTYPE:
|

ZFIN is incorporating published figure images and captions as part of an ongoing project. Figures from some publications have not yet been curated, or are not available for display because of copyright restrictions. |
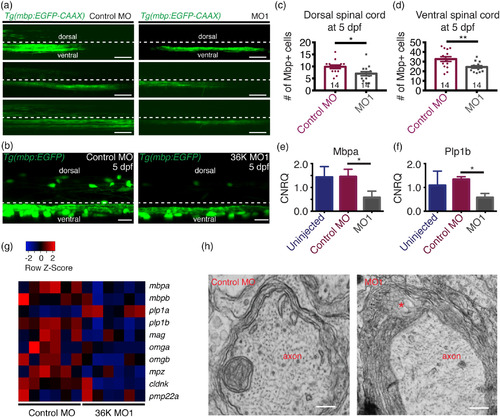
36K knockdown zfl have less and disrupted myelin. (a) Representative images depicting lateral view of the spinal cord at 4 dpf of Tg(mbp:EGFP‐caax) fish injected with control MO and MO1 showing dorsal and ventral spinal cord regions separated by a dotted line, with the region above this line being dorsal and the region below the line the ventral spinal cord. Scale bar: 40 μm. (b) Representative image depicting lateral view of two spinal segments above the yolk extension at 5 dpf in Tg(mbp:EGFP) zfl injected with control MO and MO1. Scale bars: 20 μm. (c,d) Number of mbp positive cells in two spinal segments were significantly fewer in both the (c) dorsal spinal cord (d) and in the ventral spinal cord. Unpaired two tailed t test p‐value 0.0182 (*) for (c). Unpaired two tailed t test p‐value .0087 (**) for (d). (e,f) q‐rt‐PCR data showing calibrated normalized relative quantities (CNRQ) for (e) mbpa and (f) plp1b. Target genes were normalized to ß‐actin and ef1a. N = 5. Kruskal–Wallis ANOVA p ≤ .05 (*) followed by Dunn's multiple comparisons test for control MO versus MO1. (g) Heatmap generated from microarray analysis. Color‐coded data (red = upregulation, blue = downregulation) showing expression levels of different myelin genes in rows and different batches of 3 dpf larvae in columns. (h) Transmission electron micrographs showing myelin sheets wrapped around axons in control MO and MO1 zfl at 5 dpf. Asterisk represents noticeable cytoplasmic vacuolated structures in between myelin lamellae in MO1 larva. Scale bars: 0.3 μm |
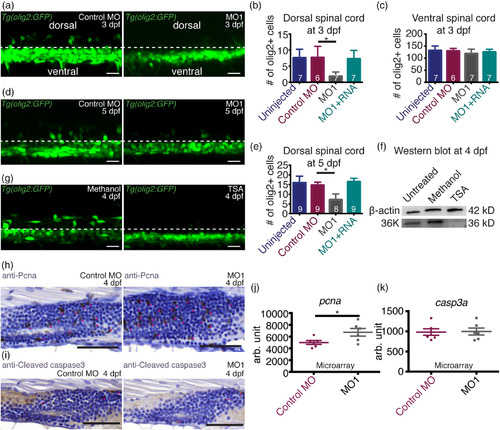
36K knockdown zfl have fewer dorsally migrated OPCs. (a) Representative image depicting lateral view of two spinal segments above the yolk extension at 3 dpf in Tg(olig2:GFP) zfl injected with control MO and MO1 showing dorsal and ventral spinal cord regions with a separation by dotted lines. (b,c) Number of olig2+ cells in two spinal segments (b) in the dorsal spinal cord and (c) in the ventral spinal cord. N = 3; n shown in each bar. For (b), Kruskal–Wallis ANOVA p ≤ .01 (**) followed by Dunn's multiple comparisons test for control MO versus MO1. For (c), Kruskal–Wallis ANOVA p > .05 (not significant). (d) Representative image depicting lateral view of two spinal segments above the yolk extension at 5 dpf in Tg(olig2:GFP) zfl injected with control MO and MO1. (e) Number of olig2 positive cells in two spinal segments in the dorsal spinal cord. N = 3; n shown in each bar. Kruskal–Wallis ANOVA p ≤ .0001 (***) followed by Dunn's multiple comparisons test for control MO versus MO1. (f) Western blot against 36K using untreated, methanol (control) and TSA treated whole larvae at 4 dpf with β‐actin as loading control. There was no 36K band detectable in the TSA treated zfl. (g) Representative lateral view of two spinal segments above the yolk extension at 4 dpf in Tg(olig2:GFP) zfl treated with methanol (control) or TSA. There were no dorsally migrated OPCs detectable in the TSA treated zfl. (h) Representative images of sagittal paraffin sections of 4 dpf larvae injected with control MO and MO1 showing proliferation within the spinal cord labeled with anti‐Pcna. Sections were counter stained with hematoxylin. Proliferating cells are marked by pink stars. There were more proliferating cells in the spinal cord of MO1 zfl compared to control MO. Scale bars: 50 μm. (i) Representative images of sagittal views of paraffin sections of 4 dpf larvae injected with control MO and MO1 showing apoptotic cells within the spinal cord labeled with anti‐Cleaved caspase 3. Sections were counter stained with hematoxylin. Apoptotic cells are marked by pink stars, no difference could be seen between MO1 and control MO zfl. Scale bars: 50 μm. (j,k) Expression of (j) pcna and (k) casp3a in control MO and MO1 at 3 dpf from microarray analysis. N = 6. Unpaired two tailed t test with Welch's correction. p‐value .0450 (*) for pcna (j), p‐value .9045 (not significant) for casp3a (k) EXPRESSION / LABELING:
PHENOTYPE:
|
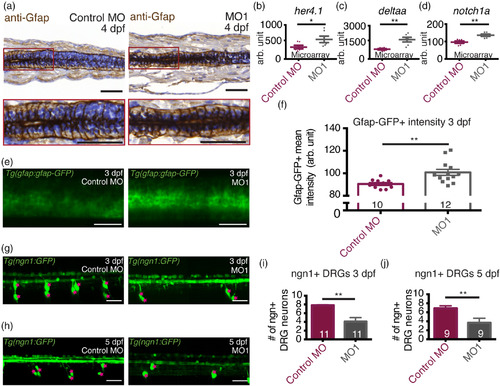
36K knockdown zfl have up‐regulated Notch targets. (a) Representative images and enlarged selections (red squares) of sagittal paraffin sections depicting spinal cords of 4 dpf zfl injected with control MO and MO1; showing radial glial cells labeled with anti‐Gfap antibodies. Sections were counter stained with hematoxylin. Scale bars: 50 μm. (b–d) Microarray analysis at 3 dpf showing up‐regulation in MO1 of (b) her4.1 (c) deltaa and (d) notch1a. N = 6. Unpaired two tailed t test with Welch's correction. p‐value .043 (*) for her4.1 (b), p‐value .002 (**) for deltaa (c), p‐value .003 (**) for notch1a (d). (e) Representative lateral view of two spinal segments above the yolk extension in TgBAC(gfap:gfap‐GFP) zfl at 3 dpf injected with control MO and MO1. Scale bars: 40 μm. (f) Mean fluorescence intensity of gfap:gfap‐GFP in the spinal cord from average projections acquired from a z stack of 125 μm. Sample sizes: N = 4; n shown in each bar. Unpaired two tailed t test with Welch's correction p‐value .0032 (**). (g,h) Representative lateral view of four spinal segments above the yolk extension in Tg(‐8.4ngn1:GFP) zfl at (g) 3 dpf and (h) 5 dpf injected with control MO and MO1. Ngn + DRG cells are marked by pink stars. Scale bars: 40 μm. (i,j) Fewer ngn1+ DRG neurons in 4 spinal segments in MO1 zfl at (i) 3 dpf and (j) 5 dpf. Sample sizes: N = 3; n shown in each bar. For (i), Mann–Whitney two tailed test p‐value .0008 (***). For (j), Mann–Whitney two tailed test p‐value .02760 (*) EXPRESSION / LABELING:
PHENOTYPE:
|
|
ZFIN is incorporating published figure images and captions as part of an ongoing project. Figures from some publications have not yet been curated, or are not available for display because of copyright restrictions. PHENOTYPE:
|