
- Title
-
Morphogenetic control of zebrafish cardiac looping by Bmp signaling
- Authors
- Lombardo, V.A., Heise, M., Moghtadaei, M., Bornhorst, D., Männer, J., Abdelilah-Seyfried, S.
- Source
- Full text @ Development
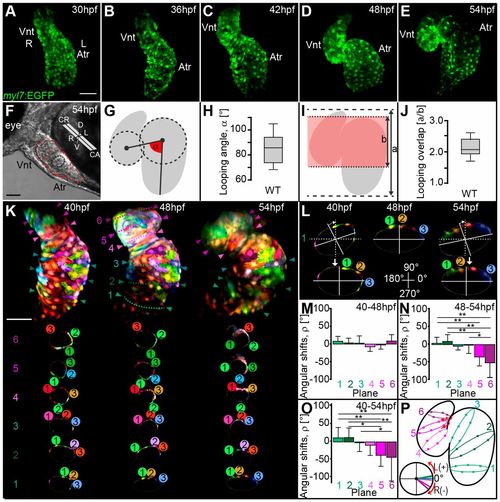
Zebrafish cardiac S-looping involves planar bending and torsional winding of the heart tube. (A-E) Reconstructions of confocal z-stacks of representative wild-type hearts expressing EGFP within myocardial tissue [Tg(mly7:EGFP)twu34] during cardiac looping stages at 30-54 hpf. (A-C) Early S-looped hearts and (D,E) advanced S-looped hearts. (F) Light microscopic image showing the positioning of the heart within the embryonic body axes at 54 hpf. (G,I) Schematic models illustrating how ‘heart bending extension’ was quantified at 54 hpf. (G) Scheme of looping angle (α, red angle). (I) The index a/b (red shading indicates overlap of heart chambers). (H,J) Looping angles (α) and index a/b of wild-type hearts at 54 hpf. The limits of the boxes indicate the range between the first quartile (25th percentile) and the third quartile (75th percentile). The line inside box indicate the median value. The error bars indicate the maximum and minimum values. (K-P) Zebrafish cardiac looping morphogenesis involves torsion of the heart. (K) Reconstruction of confocal z-scan images taken from a time series (40-54 hpf). In vivo multi-color mosaic-labeling based on 1- to 4-cell stage plasmid injections into Tg(myl7:EGFP)twu34 transgenic zebrafish (false-colored red). At least three myocardial cells within each cross-section plane were tracked during looping morphogenesis. One reference plane was used to ensure the consistent orientation of the imaged hearts at 40, 48 and 54 hpf. (L) Representative angular realignment of cross-section plane 1. Cross-section planes at 40 and 54 hpf were reoriented to align with the orientation of the cross-section plane at 48 hpf. Angular shifts (ρ) for each plane were calculated based on these realignments. (M-O) Quantifications of the heart torsion based on calculations of ρ for each cross-section plane occurring during (M) 40-48 hpf, (N) 48-54 hpf and (O) 40-54 hpf. (P) Schematic representation showing right-angular shifts [R(−)] close to the outflow tract of the ventricle (planes 5 and 6). All values are mean±s.d (Table S2A); *P≤0.05; **P≤0.01 (Table S2B). Atr, atrium; Vnt, ventricle; CR, cranial; CA, caudal; D, dorsal; V, ventral; L, left; R, right; L(+), left-angular shift; R(−), right angular shift. Scale bars: 50 μm in A-E,K; 100 μm in F. |
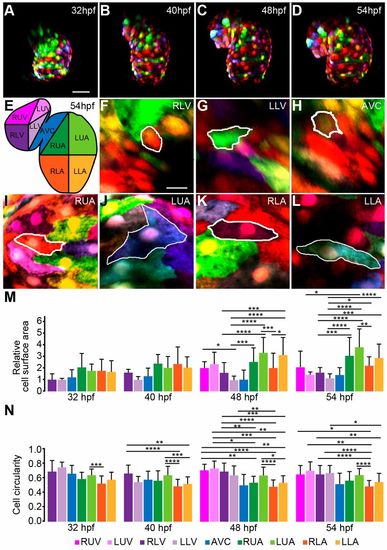
Anisotropic growth of myocardial cells contributes to asymmetric ballooning of the heart chambers. (A-D) Reconstructions of confocal z-scan images taken from a time series (32-54 hpf). Individual cell size and shape changes during cardiac looping stages were quantified based on in vivo multi-color mosaic-labeling by 1- to 4-cell stage plasmid injections into Tg(myl7:EGFP)twu34 transgenic zebrafish (false-colored red). (E) Schematic of different heart chamber regions at 54 hpf. RUV, right upper ventricle; LUV, left upper ventricle; RLV, right lower ventricle; LLV, left lower ventricle; AVC, atrio-ventricular canal; RUA, right upper atrium; LUA, left upper atrium; RLA, right lower atrium; LLA, left lower atrium. (F-L) Regional differences in myocardial cell surface areas and morphologies at 54 hpf. (M,N) Quantifications of dynamic changes in (M) myocardial cell surface area (values are shown relative to the RLV region at 32 hpf) and (N) myocardial cell circularity between 32 and 54 hpf. Kruskal–Wallis test was used for multiple comparisons between the different cardiac regions (statistical analysis in Tables S4 and S5). Data are mean±s.d.; *P≤0.05; **P≤0.01; ***P≤0.001; ****P≤0.0001. Scale bars: 50 μm in A-D; 10 μm in F-L. |
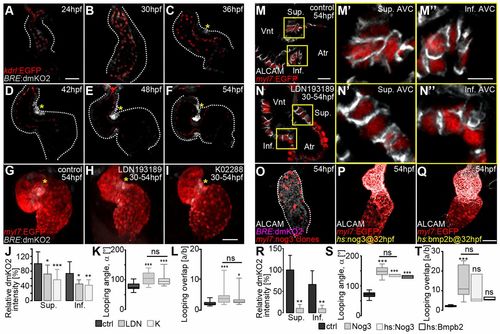
Bmp signaling activity is asymmetric during S-looping morphogenesis. (A-F) Reconstructions of confocal z-scans of wild-type hearts expressing the Bmp signaling reporter transgene Tg(BRE:dmKO2)mw40 (false-colored gray) in combination with the Tg(kdrl:EGFP)s843 endocardial/endothelial reporter line (false-colored red) during heart looping morphogenesis (myocardium, dotted lines). (A,B) Initially, Bmp signaling is present within the entire endocardium and only weakly expressed within the myocardium. During early (C,D) and advanced (E,F) S-looping stages, BMP activity increases at the superior AVC (yellow asterisks) and more weakly at the inferior AVC. (G-L) Pharmacological inhibition of Bmp signaling using LDN193189 (20 μM) and K02288 (20 μM) inhibitors between 30 and 54 hpf. (G-I) Reconstruction of confocal z-stacks of the Bmp Tg(BRE:dmKO2)mw40 and myocardial Tg(mly7:EGFP)twu34 (false-colored red) reporter lines treated with (G) 0.2% DMSO (control), (H) LDN193189 or (I) K02288. Both LDN193189 and K02288 result in defective cardiac looping. Yellow asterisks highlight Bmp signaling within myocardium. (J-L) Bmp inhibition decreases the relative dmKO2 intensity at the superior (Sup.) and inferior (Inf.) AVC (J), increases the looping angle (α) (K) and decreases the looping overlap (increase in the index a/b) (L). (M-N″) Myocardial cell morphologies within the superior and inferior AVC after Bmp inhibition. (M,N) Single z-stack section images of ALCAM immunolabeled (false-colored white) and Tg(myl7:EGFP)twu34 myocardial reporter-expressing hearts (false-colored red) of embryos treated (M) with 0.2% DMSO (control) or (N) with LDN193189 between 30 and 54 hpf. (M′-N″) Enlargements of the areas outlined in M and N. Whereas myocardial cells at the superior AVC of control hearts have a columnar and conical shape (M′), the morphologies of AVC cells are cuboidal after Bmp inhibition (N′). Myocardial cells at the inferior AVC are cuboidal in control (M″) and in LDN-treated (N″) hearts. (O-T) Alterations in BMP signaling affect cardiac S-looping. (O-Q) Reconstructions of confocal z-scans of representative hearts. (O) Clonal overexpression of the BMP antagonist Noggin 3 causes a downregulation of the Bmp reporter transgene Tg(BRE:dmKO2)mw40 within the heart and an abnormal morphology. Overexpression of either (P) Noggin 3 [Tg(hsp70I:Nog3)fr14 transgenic line] or (Q) Bmp2B [Tg(hsp70:Bmp2b)fr13 transgenic line] by heat shock at 32 hpf causes cardiac looping defects at 54 hpf. (R) Clonal overexpression of Noggin 3 decreases expression of the Bmp reporter transgene Tg(BRE:dmKO2)mw40 at the superior (Sup.) and inferior (Inf.) AVC (Table S5). (S,T) Misregulated Bmp signaling causes an increase in looping angles (α) (Table S1) (S) and in the index a/b (Table S1) (T). In K,L,S,T, the limits of the boxes indicate the range between the first quartile (25th percentile) and the third quartile (75th percentile). The line inside box indicate the median value. The error bars indicate the maximum and minimum values. Data are mean±s.d. in J,R; ns, not significant; *P≤0.05; **P≤0.01; ***P≤0.001. Scale bars: 50 μm in A-I,O-Q; 20 μm in M,N; 10 μm in M′-N″. |
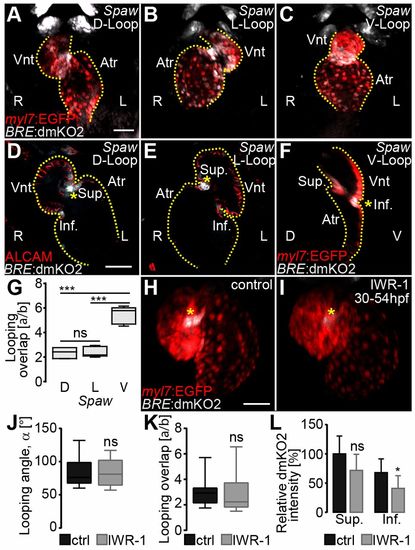
Establishment of asymmetric Bmp signaling within the AVC is not dependent on Nodal or Wnt signaling. (A-C) Loss of the Nodal ligand Spaw results in D-looped (A), L-looped (B) or V-looped (C) hearts (D, L and V refer to the ventricular position with respect to embryonic body axes). (A-C) Reconstructions of confocal z-scans of representative 54 hpf spaw morphant hearts with expression of Bmp Tg(BRE:dmKO2)mw40 (false-colored gray) and myocardial Tg(mly7:EGFP)twu34 (false-colored red) reporter lines. Frontal view of hearts imaged on fixed embryos. R, right; L, left embryonic side. (D,E) Confocal z-stacks in the right-left (R-L) plane of representative D- (D) and L- (E) looped hearts with Bmp signaling activity, as indicated by Tg(BRE:dmKO2)mw40 and myocardial cell borders immunolabeled against ALCAM (false-colored red). Hearts looped within the R-L plane show Bmp activity in both chirality orientations within myocardial cells of the AVC (yellow asterisk). (F) Confocal z-stack image in the dorsal-ventral (D-V) plane of a V-looped heart with Bmp Tg(BRE:dmKO2)mw40 and myocardial Tg(mly7:EGFP)twu34 reporter lines. The outline of the heart is delineated by a yellow dotted line. Atr, atrium; Vnt, ventricle; Sup., superior AVC; Inf., inferior AVC. (G) Quantification of index a/b (data in Table S1). (H-L) The Wnt signaling pathway it is not involved in cardiac S-looping morphogenesis. (H,I) Reconstruction of confocal z-stacks of representative transgenic hearts with the Bmp reporter Tg(BRE:dmKO2)mw40 and myocardial reporter Tg(mly7:EGFP)twu34. 0.1% DMSO-treated (control) (H) or Wnt inhibitor IWR-1-treated (I) hearts show Bmp signaling within the myocardium (yellow asterisks). (J-L) Looping angle (α) (data in Table S1) (J), index a/b (data in Table S1) (K) and relative dmKO2 intensity (L) at the superior AVC are not significantly affected by IWR-1 treatment (data in Table S5). (L) The relative dmKO2 intensity at the inferior AVC is slightly reduced (P≤0.05) after IWR-1 treatment (statistical analysis in Table S5). In G,J,K, the limits of the boxes indicate the range between the first quartile (25th percentile) and the third quartile (75th percentile). The line inside box indicate the median value. The error bars indicate the maximum and minimum values. Data are mean±s.d. in L; ns, not significant; *P≤0.05, ***P≤0.001. Scale bars: 50 μm. |
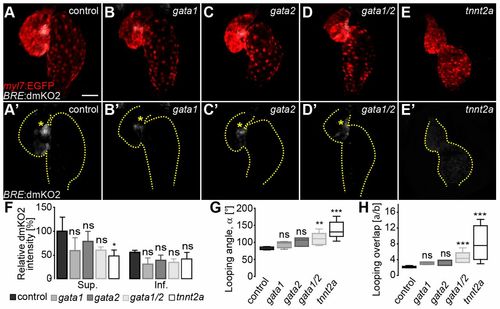
Cardiac contractility is required for Bmp signaling at the superior AVC. (A-E) Reconstructions of confocal z-stacks of hearts at 54 hpf in (A) wild-type, (B) gata1 morphant, (C) gata2 morphant, (D) gata1/2 double morphant or (E) tnnt2a morphant embryos. Myocardial tissue is marked by expression from the Tg(mly7:EGFP)twu34 reporter (false-colored red) and Bmp reporter Tg(BRE:dmKO2)mw40 (false-colored gray). (A′-E′) Bmp reporter Tg(BRE:dmKO2)mw40 expression. The outline of the heart is delineated by dotted lines. Asymmetric Bmp signaling activity within the superior AVC is marked by yellow asterisks. (F-H) Quantifications of (F) relative dmKO2 intensities at the superior (Sup.) and inferior (Inf.) AVC (data in Table S5), (G) looping angle (α) (data in Table S1), and (H) index a/b (data in Table S1) were measured in gata1, gata2, gata1/2 and tnnt2a morphant versus wild-type hearts. Under abnormal hemodynamic conditions (gata1, gata2 and gata1/2 morphant hearts) the relative dmKO2 intensity is not significantly affected. However, asymmetric Bmp signaling activity is lost in the absence of cardiac contractility. The looping angle (α) (G) and the index a/b (H) are significantly increased in gata1/2 and tnnt2a morphant versus control hearts (statistical analysis in Table S1). In G,H, the limits of the boxes indicate the range between the first quartile (25th percentile) and the third quartile (75th percentile). The line inside box indicate the median value. The error bars indicate the maximum and minimum values. Data are mean±s.d. in F; ns, not significant; *P≤0.05; **P≤0.01; ***P≤0.001. Scale bar: 50 μm. |
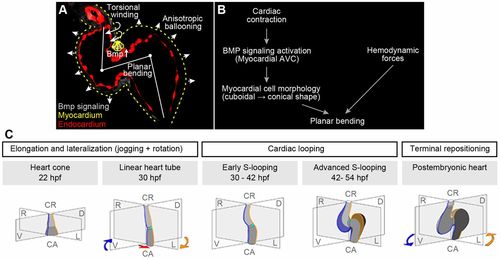
Model of zebrafish cardiac looping. (A) Summary of cellular processes that contribute to zebrafish S-looping morphogenesis: (1) BMP-dependent planar bending (white line at heart midline) of the heart tube due to cuboidal-to-conical cell shape changes of superior AVC cardiomyocytes (yellow triangles); (2) myocardial anisotropic ballooning due to region-specific cell morphology changes causes an expansion of the two cardiac chambers (white arrowheads); and (3) ventricular rightward-torsional winding (twisted arrows at ventricular outflow tract) is most pronounced at the cranial pole of the heart. Bmp signaling (false-colored gray) with strong activation at myocardial superior AVC, myocardium (yellow dotted lines) and endocardium (false-colored red). (B) Summary of cell-intrinsic and -extrinsic factors involved in cardiac planar bending of the heart tube. Cardiac contractility is essential for a strong Bmp signaling pathway activation within myocardial cells at the superior AVC region. This Bmp activation induces myocardial changes from cubical to conical cell shapes and results in an S-planar bending of the heart tube. In addition, hemodynamic forces (shear stress and retrograde flow fraction) affect Bmp signaling-independent planar bending. (C) During zebrafish cardiac looping morphogenesis, two separate processes occur in parallel: (1) planar S-looping along the mid-sagittal body axis and (2) lateral looping during which the ventricle is positioned towards the right and the atrium towards the left (D-looping). The mid-sagittal plane is in grey; original right and left sides of the heart are marked in blue and yellow, respectively. Under some experimental conditions, inverted L-looping can also occur. In comparison with lung-breathing vertebrates, the zebrafish atrium turns around the cardiac cranio-caudal axis. The rotation of the atrium turns the cross-section plane of the AVC along the cranio-caudal axis towards the right. This movement is ‘corrected’ during repositioning, which places the ventricle and atrium into an almost bilateral symmetrical position again. |