FIGURE SUMMARY
Title

Prepontine non-giant neurons drive flexible escape behavior in zebrafish

Authors
Marquart, G.D., Tabor, K.M., Bergeron, S.A., Briggman, K.L., Burgess, H.A.
Source
Full text @ PLoS Biol.

Ballistic and delayed escape reactions performed by larval zebrafish.

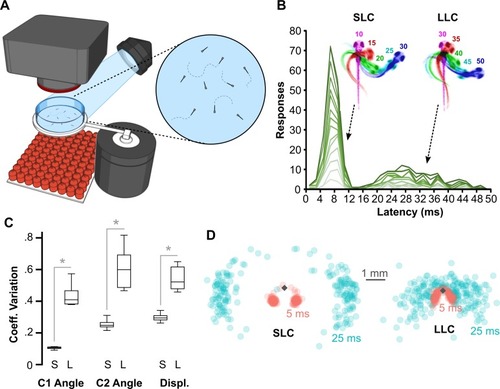
(A) Schematic of behavioral experiments in free-swimming larvae: groups of 15–20 6-dpf larvae were imaged from above at 1,000 frames per second with a high-speed camera. An infrared LED array below provided illumination. Nondirectional acoustic/vibratory stimuli were delivered to the arena by a minishaker. (B) Frequency histogram of response latencies for individual larvae (n = 15). Inset: Time-lapse images of initial C-bend for larvae performing an SLC or an LLC, color-coded by millisecond poststimulus. (C) Coefficient of variation (“Coeff. Variation”) for the initial bend angle (“C1”), counterbend angle (“C2”), and net displacement (“Displ.”) for SLC (“S”) and LLC (“L”) responses. n = 16 groups of larvae. *p < 0.001, paired t test. (D) Spatial distribution of head locations 5 ms (red) and 25 ms (blue) after escape initiation for SLC (n = 199) and LLC (n = 220) reactions, relative to initial position (diamond). Underlying numerical data are included in S1 Data. dpf, day post-fertilization; LED, light-emitting diode; LLC, long-latency C-start; SLC, short-latency C-start.

A cluster of neurons in the prepontine hindbrain initiates delayed escapes.

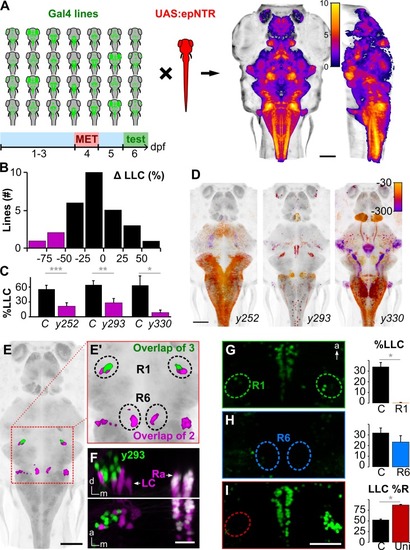
(A) Schematic of circuit-breaking screen: 28 Gal4 enhancer trap lines were crossed to UAS:epNTR, and labeled neurons were ablated and tested for escape behavior. Right: heat maps representing maximum horizontal and sagittal projections of brain coverage (number of lines labeling a given voxel). (B) Histogram of the change in LLC probability following ablation (compared to MET-treated non-epNTR-expressing sibling controls) for each line screened. Magenta: Gal4 lines with a >50% reduction. A minimum of 7 larvae were used per condition per line. %LLC is the percentage of trials on which an LLC was performed as a fraction of trials with no SLC response. (C) LLC probability for lines highlighted in (B). LLC probability after ablation (magenta) and in MET-treated sibling controls (black). y252-Gal4 (n = 22 control, 31 ablated larvae), y293-Gal4 (n = 17, 17), y330-Gal4 (n = 8, 7). ***p < 0.001, **p < 0.01, *p < 0.05, t test. (D) Maximum horizontal projections for Gal4 lines with reduced LLC probability after ablation. Expression is color-coded for depth (μm below image top). (E) Expression overlap between y252-Gal4 and y293-Gal4 (magenta) and between all 3 lines (green). Boxed area enlarged in (E'). (F) Coronal (top) and dorsal (bottom) projections of confocal substacks through the R1 cluster in y293-Gal4; UAS:Kaede (green); vmat2:GFPpku2 (magenta) larvae. Prior to imaging, Kaede was photoconverted to red. Arrows indicate LC and Ra labeled by vmat2:GFP. Both Kaede and GFP are expressed in the raphe (white). (G-H) LLC probability after laser ablation of R1 (G, n = 9) and R6 (H, n = 16) in y293-Gal4. *p < 0.05, t test. (I) Percent of LLCs made in a rightward direction after left R1 ablation (“Uni,” n = 14) and nonablated controls (n = 24). *p < 0.05, t test. Scale bars: 100 μm in (A, D, E); 25 μm in (F); 40 μm in (G-I). Underlying numerical data are included in S1 Data, and unprocessed image stacks in (F) are available at https://doi.org/10.5281/zenodo.3382102. a, anterior; d, dorsal; dpf, day post-fertilization; epNTR, engineered nitroreductase variant; GFP, green fluorescence protein; LC, locus coeruleus; LLC, long-latency C-start; m, medial; MET, metronidazole; R1, rhombomere 1; Ra, raphe; SLC, short-latency C-start.

Optogenetic prepontine neuron stimulation elicits C-start behavior.

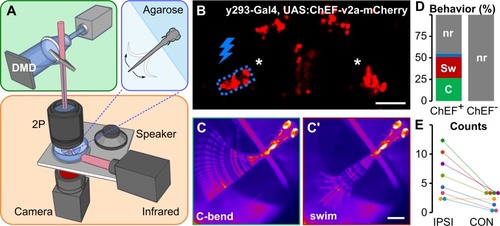
(A) Schematic of optogenetic stimulation and two-photon calcium imaging: a DMD was used to spatially restrict 460-nm LED excitation (green box) within the brain of head-embedded larvae (blue box) mounted on a stage with a speaker for acoustic/vibratory stimulation, an infrared light source for tail illumination, and a high-speed camera for behavioral readout (orange box). (B) Two-photon optical section of mCherry expression in y293-Gal4, UAS:ChEF-2a-mCherry larva with the area around one prepontine cluster (asterisks) stimulated by the DMD outlined in blue. Scale bar 40 μm. (C) C-start and swim-like (C') behaviors elicited by unilateral optogenetic stimulation of prepontine neurons in y293-Gal4, UAS:ChEF-positive larvae. Scale bars 500 μm. (D) Percent of behaviors elicited by illumination of larvae expressing ChEF (ChEF+; 229 trials, n = 8 larvae) and nonexpressing sibling controls (ChEF; 63 trials, n = 7 larvae). C-start-like responses (“C,” green), swim-like bouts (“Sw,” red), other responses (blue), nr (gray). (E) Number of C-start responses made ipsilateral (“IPSI”) and contralateral (“CON”) to the side of optogenetic stimulation, color-coded for each of the 8 larvae tested. χ2 = 15.25, *p < 0.001. Underlying numerical data are included in S1 Data. DMD, digital mirror device; LED, light-emitting diode; mCherry, monomeric Cherry; nr, no response.

Prepontine escape neurons project reciprocally to the caudal hindbrain and cerebellum.

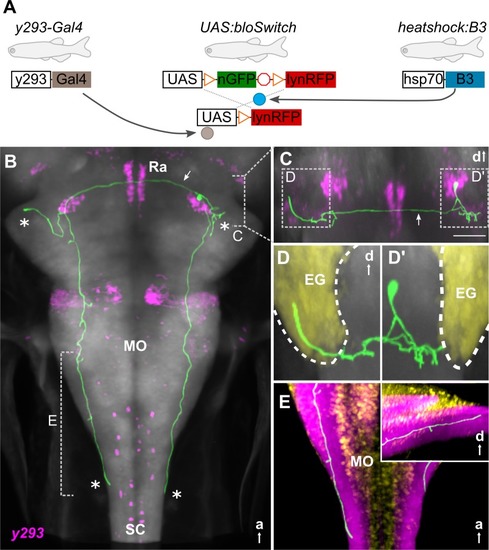
(A) Schematic of 3 transgene system used for B3-recombinase–based neuronal tracing. (B-E) Representative traced neuron in 6-dpf larva (green, for others, see S5 Fig), registered to ZBB atlas [18]. Background is elavl3:Cer (gray). (B) Horizontal maximum whole-brain projection of a reconstructed neuron from y293-Gal4 (ZBB, magenta). Asterisks: projections of the 4 primary neurites. Arrow: commissural projection. Dashed lines indicate views in (C) and (E). (C) Coronal substack projection from the area indicated in (B). Arrow: commissural projection. Scale bar 50 μm. Views in (D) outlined. (D) Coronal projections of neurites extending into the ipsilateral (D') and contralateral (D) EG (yellow). (E) Dorsal projection through the caudal medulla lateral neuropil area (ZBB anti-zrf2, purple). Cellular regions labeled by Tg(elavl3:nls-mCar)y517 (ZBB, yellow). Inset: sagittal view of same region. a, anterior; d, dorsal; EG, eminentia granularis; hsp70, heat-shock protein 70; lynRFP, membrane-tagged red fluorescent protein; MO, medulla oblongata; nGFP, nuclear-localized green fluorescent protein; Ra, raphe; SC, spinal cord; ZBB, Zebrafish Brain Browser.

Delayed escape trajectories are guided by visual information.

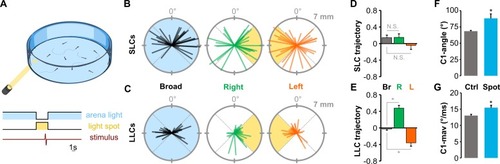
(A) Schematic of experiment measuring escape direction under broad-field illumination or in darkness with only a light spot illuminated. Scale bar 1 s. (B-C) Thirty representative SLC (B) and LLC (C) escape trajectories of larvae to a nondirectional acoustic/vibratory stimulus when under broad-field illumination (“Broad”) or when oriented to the left or to the right of a light spot. Escape direction is plotted radially and net displacement axially. (D-E) Mean direction choice (−1 all left; +1 all right) for SLC (D) and LLC (E) responses under broad-field illumination (“Br”; SLC, n = 367 responses; LLC, n = 372) or when the light-spot was to the left (“L”; SLC, n = 131 responses; LLC, n = 257) or to the right of the larva (“R”; SLC n = 143; LLC, n = 283). *p < 0.001, t test. (F-G) Mean initial bend angle (F) and maximum angular velocity (G) for LLCs performed under broad-field illumination (gray) or during directionalized responses with a light spot. *p < 0.01, t test. Underlying numerical data are included in S1 Data. Ctrl, control; LLC, long-latency C-start; N.S., not significant; SLC, short-latency C-start.

Prepontine neurons are active during ipsilateral delayed escapes.

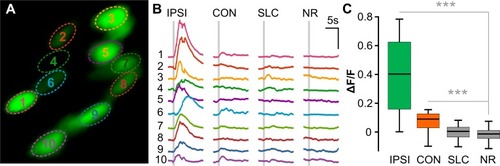
(A) Two-photon optical section of nuclear-localized GCaMP6s-positive prepontine neurons in y293-Gal4 with ROIs shown in (B) indicated. (B) Representative GCaMP6s traces for ROIs in (A) for ipsilateral LLCs (“IPSI”), contralateral LLCs (“CON”), SLCs, and NR trials. Each vertical set of GCaMP6s traces are from the same trial. Gray bar: acoustic stimulus. Scale bar 1 ΔF/F, 5 s. (C) Change in GCaMP6s fluorescence (ΔF/F) across response types: ipsilateral LLCs, contralateral LLCs, SLCs, and NR trials (31 neurons, n = 3 larvae). ***p < 0.001, t test. Underlying numerical data are included in S1 Data. LLC, long-latency C-start; NR, no response; ROI, region of interest; SLC, short-latency C-start.

Escape pathways in zebrafish.

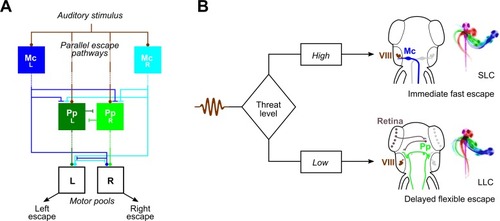
(A) Parallel sensory pathways transmit acoustic information to M-cells (“McL” and “McR”) and prepontine escape neurons (“PpL” and “PpR”). Decision-making is based on reaction time: VIIIth nerve activation of M-cells is direct, whereas prepontine neurons receive auditory information only via an indirect pathway, allowing active M-cells to prevent the initiation of delayed escapes. Additionally, Mauthner cells inhibit prepontine escape neurons, likely through an indirect pathway. Dashed lines indicate indirect connections. (B) Anatomy corresponding to the model in (A). Auditory signals from the statoacoustic ganglion (VIII, brown) excite M-cells (“Mc,” blue) directly (top) or prepontine escape neurons (“Pp,” green) indirectly (bottom). M-cells receive predominantly ipsilateral inputs and project commissurally to drive fast escapes, whereas prepontine escape neurons project both ipsi- and contralaterally and may drive escape in either direction, although predominantly ipsilaterally. LLC, long-latency C-start; M-cell, Mauthner cell; SLC, short-latency C-start.

Acknowledgments
This image is the copyrighted work of the attributed author or publisher, and ZFIN has permission only to display this image to its users. Additional permissions should be obtained from the applicable author or publisher of the image. Full text @ PLoS Biol.