FIGURE SUMMARY
Title

Enrichment of hematopoietic stem/progenitor cells in the zebrafish kidney

Authors
Kobayashi, I., Kondo, M., Yamamori, S., Kobayashi-Sun, J., Taniguchi, M., Kanemaru, K., Katakura, F., Traver, D.
Source
Full text @ Sci. Rep.

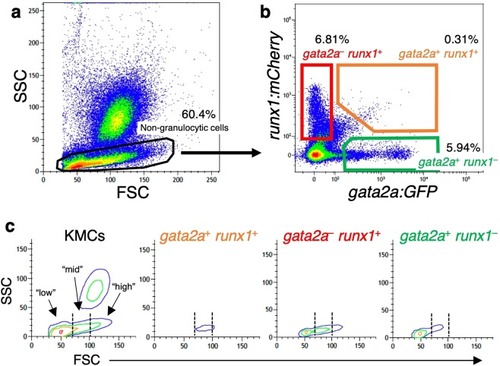
Isolation of HSPCs from the zebrafish kidney. FCM analysis of KMCs was performed in a gata2a:GFP; runx1:mCherry double-transgenic zebrafish. (a) A scatter profile of KMCs. The SSClow non-granulocytic cell fraction is gated. (b) SSClow cells are subdivided into three distinct hematopoietic populations, gata2a+runx1+ (orange gate), gata2arunx1+ (red gate), and gata2a+runx1 (green gate). (c) Contour plot of FSC vs. SSC in KMCs, gata2a+runx1+, gata2arunx1+, and gata2a+runx1 cells. Dotted lines separate the “low”, “mid”, and “high” intensity of FSC.

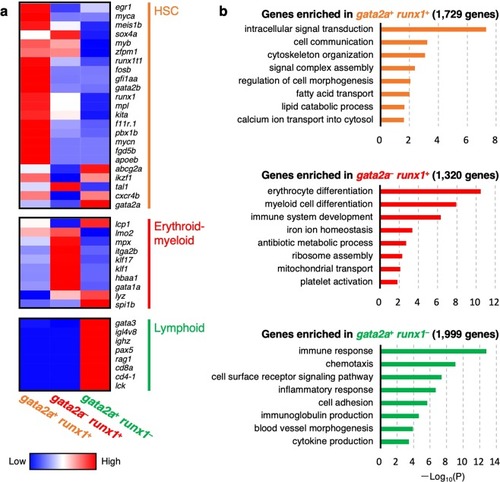
Transcriptome analysis of three distinct hematopoietic populations. (a) Hierarchical clustering of selected HSC- (upper), erythroid-myeloid- (middle), and lymphoid-related genes (lower). (b) Gene ontology enrichment analysis of highly expressed genes in gata2a+runx1+ (upper), gata2arunx1+ (middle), or gata2a+runx1 cells (lower).

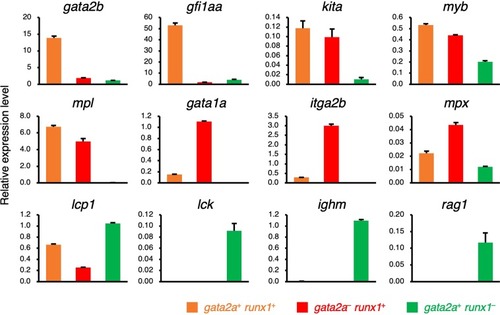
Expression of hematopoietic marker genes in HSPC populations. Relative expression levels of hematopoietic marker genes are shown. Orange, red, and green bars denote gata2a+runx1+, gata2arunx1+, and gata2a+runx1 cells, respectively. The expression level in the kidney tissue is shown as 1.0 in each panel. Error bars, s.d.

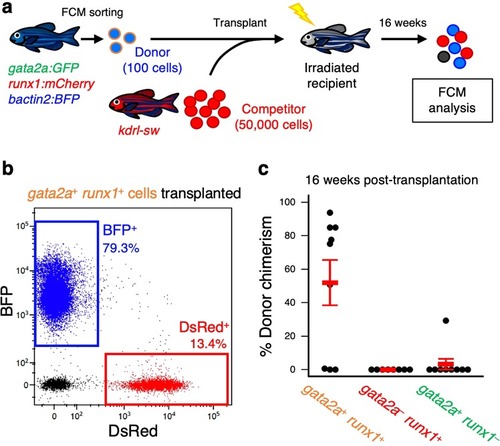
Transplantation assays of HSPC populations. (a) Experimental procedure of a competitive repopulation assay. One hundred BFP-labeled donor cells were co-transplanted with 50,000 of DsRed-labeled KMCs (competitors) into a sublethally irradiated recipient animal. At 16 wpt, donor chimerism was determined by the percentage of BFP+ cells within the total BFP+ and DsRed+ cells in each recipient. (b) Representative result of FCM analysis in a recipient transplanted with gata2a+runx1+ cells. (c) Percentage of donor chimerism in each recipient group (mean ± s.e.m).

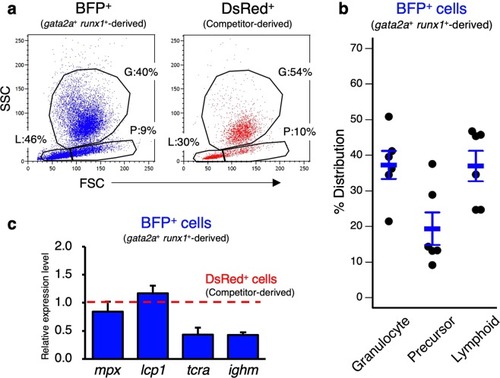
Multilineage differentiation of gata2a+runx1+ cells. (a) Representative result of FCM analysis of KMCs in a recipient co-transplanted with BFP-labeled gata2a+runx1+ cells and DsRed-labeled competitors. G, granulocyte; P, precursor; L, lymphoid. (b) Percent distribution of gata2a+runx1+-derived BFP+ cells in “granulocyte”, “precursor”, and “lymphoid”. Data show the mean ± s.e.m. in the recipients (n = 6). (c) Relative expression level of lineage marker genes in isolated gata2a+runx1+-derived BFP+ cells in a recipient. Red dotted line indicates the expression level of each gene in competitor-derived DsRed+ cells.

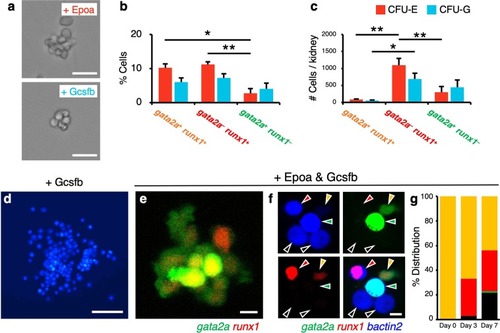
Colony-forming assays of HSPC populations. (a) Representative images of a colony formed in the presence of Epoa (CFU-E) or Gcsfb (CFU-G). (b,c) Percentage (b) and absolute number (c) of CFU-E (red bars) and CFU-G (blue bars) in gata2a+runx1+, gata2arunx1+, or gata2a+runx1 cells in the kidney. Data are shown as mean ± s.e.m. *p < 0.01; **p < 0.001 by one-way ANOVA with Dunnett’s test. (d) Representative image of a large colony observed in the well plated with gata2a+runx1+ cells in the presence of Gcsfb. The image shows cells expressing BFP. (e,f) Representative images of a colony formed by gata2a+runx1+ cells in the presence of both Epoa and Gcsfb. Orange, red, green, and black arrowheads in (f) indicate gata2a+runx1+, gata2arunx1+, gata2a+runx1, and gata2arunx1 cells, respectively. (g) Percent distribution of individual GFP+ mCherry+ (orange bar), GFP mCherry+ (red bar), GFP+ mCherry (green bar), and GFP mCherry (black bar) cells at day 0, 3, and 7 of culture. Bars, 20 μm (a), 100 μm (d), 5 μm (e,f).

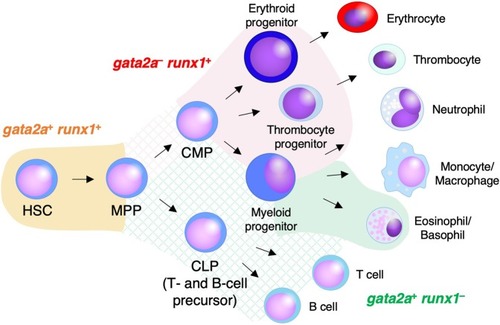
Hematopoietic differentiation in the zebrafish kidney. Schematic diagram of hematopoietic differentiation in the zebrafish kidney is shown. The orange, red, and green area denote the phenotypic transgene expression of gata2a:GFP and runx1:mCherry. Cross-hatched area shows the putative expression of gata2a:GFP and runx1:mCherry in hematopoietic progenitors. Long-term repopulating HSCs show gata2a+runx1+. In contrast, gata2arunx1+ cells are mostly erythroid- and thrombocyte-primed progenitors, but also some myeloid-primed progenitors. Additionally, some myeloid-primed progenitors are gata2a+runx1. Lymphoid-primed progenitors/precursors may express gata2a:GFP, but not runx1:mCherry.

Acknowledgments
This image is the copyrighted work of the attributed author or publisher, and ZFIN has permission only to display this image to its users. Additional permissions should be obtained from the applicable author or publisher of the image. Full text @ Sci. Rep.