
- Title
-
Oligogenic Effects of 16p11.2 Copy-Number Variation on Craniofacial Development
- Authors
- Qiu, Y., Arbogast, T., Lorenzo, S.M., Li, H., Tang, S.C., Richardson, E., Hong, O., Cho, S., Shanta, O., Pang, T., Corsello, C., Deutsch, C.K., Chevalier, C., Davis, E.E., Iakoucheva, L.M., Herault, Y., Katsanis, N., Messer, K., Sebat, J.
- Source
- Full text @ Cell Rep.
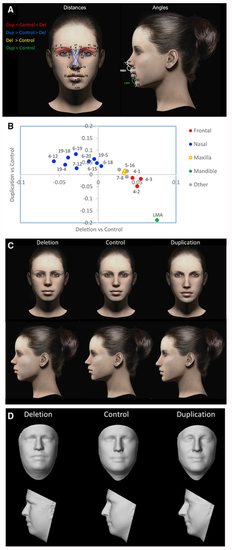
(A) On each 3D facial image, 24 landmarks were placed and two angular measurements were calculated. A description of landmarks is provided in (B) 18 measures were significant after correction for a FWER <5%. Regression coefficients for duplication versus control (y axis) and deletion versus control (x axis) show that reciprocal CNVs have reciprocal effects on growth of the major craniofacial processes. The category “Other” represents features that span multiple processes. The 14 most informative facial features based on LASSO selection are drawn in (A) and colored by facial region according to the legend. For clarity, some nasal distances are excluded. (C) Facial features associated with deletion and duplication were visualized as a computer-generated model face in which specific features were adjusted according to the observed effect sizes (from B and (D) The average surface topography was generated from multiple (>5) age-matched subjects with each genotype. Note that subtle differences in BMI are also apparent; however, these effects are controlled for in the statistical analysis and do not influence the feature selection. |
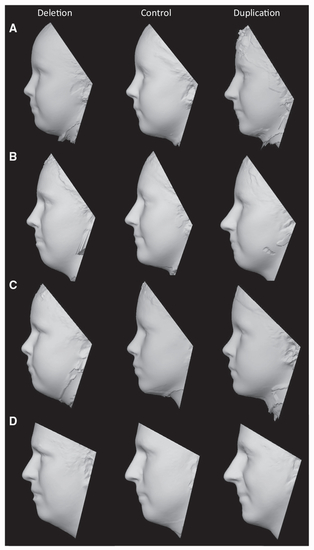
(A–D) 3D models were generated by averaging of the surface topography of faces from multiple subjects. Separate models were constructed for (A) female children (deletion: n = 7, mean age 9.15 years; control: n = 8, mean age 9.92 years; duplication: n = 5, mean age 12.73 years), (B) female adults (deletion: n = 4, mean age 20.13 years; control: n = 8, mean age 23.71 years; duplication: n = 5, mean age 23.25 years), (C) male children (deletion: n = 7; mean age 8.90 years; control: n = 9, mean age 9.27 years; duplication: n = 9, mean age 9.20 years), and (D) male adults (deletion: n = 5; mean age 25.53 years; control: n = 10, mean age 36.59 years; duplication: n = 5, mean age 36.48 years). |
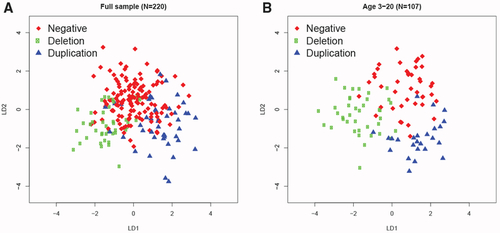
(A and B) Discriminant coefficients based on features that were significant at FDR <0.05 can distinguish the subjects based on genotype, with better discrimination for younger subjects (age ≤ 20 years). The linear model was controlled for age, head circumference, BMI, sex, and ancestry principal components. Linear discriminant analysis was applied to subjects for which the above demographic information was complete for the full sample (N = 220; 8 had missing predictors; A) and the younger group (N = 107; 6 had missing predictors; B). |
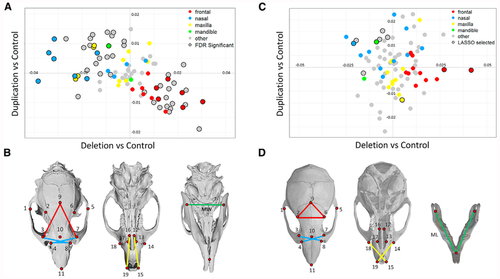
All pairwise distances were analyzed for nineteen landmarks on the dorsal skull and three on the mandible as shown here and in (A) In the rat models, 52 individual features differed significantly by genotype. Regression coefficients for the duplication deletion show significant mirror effects. (B) Informative features were identified by LASSO selection, and features that correspond to a specific facial process in rat are shown. (C) In the mouse models, 12 craniofacial measures that discriminated mutant and control groups were selected by LASSO. Regression coefficients of these features show mirror effects of deletion and duplication similar to those in human and rat. (D) Features that correspond to specific facial processes in mouse. |
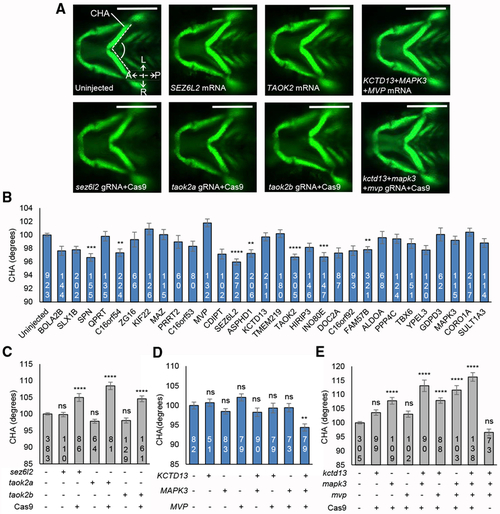
(A) Representative ventral images of − (B) Quantitative assessment of the CHA of larvae injected with single human mRNAs for each of the 30 genes located in the 16p11.2 BP4-BP5 region. Images were measured as shown in (A) (angle between dashed lines). Seven transcripts induced a significant reduction in CHA after Tukey’s p value adjustment (adjusted p < 0.01). Dosage is 12.5 pg for (C) Quantitative assessment of the CHA of F0 mutant batches injected with single combinations of each of (D) Quantitative assessment of the CHA of larvae injected with single or equimolar combinations of human (E) Quantitative assessment of the CHA of F0 mutant batches injected with single or equimolar combinations of PHENOTYPE:
|

ZFIN is incorporating published figure images and captions as part of an ongoing project. Figures from some publications have not yet been curated, or are not available for display because of copyright restrictions. PHENOTYPE:
|