
- Title
-
Notch signalling maintains Hedgehog responsiveness via a Gli-dependent mechanism during spinal cord patterning in zebrafish
- Authors
- Jacobs, C.T., Huang, P.
- Source
- Full text @ Elife
Whole-mount double fluorescent in situ hybridisation was performed in wild-type embryos at 24 hpf for |
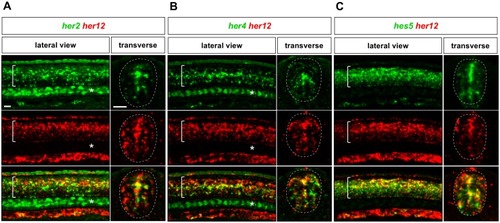
Whole-mount double fluorescent in situ hybridisation was performed in wild-type embryos at 24 hpf for |
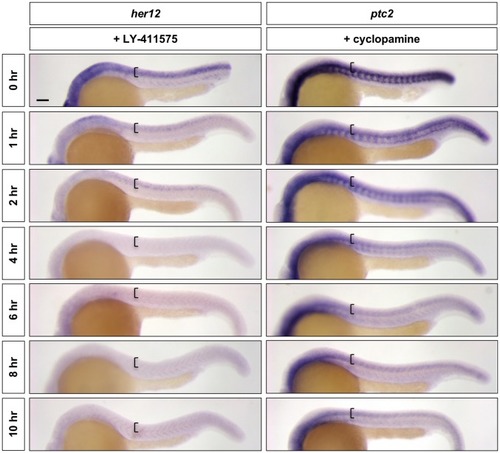
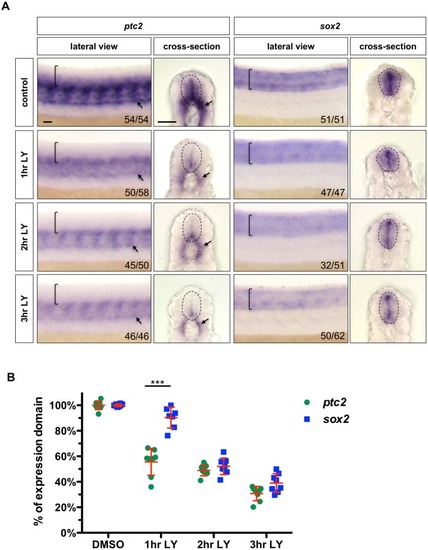
Wild-type embryos were treated with LY-411575 or cyclopamine for 0, 1, 2, 4, 6, 8, or 10 hr, and fixed at 24 hpf. Whole mount in situ hybridisation was then performed for |
|
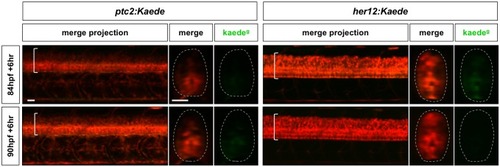
Continuation of the time course described in |
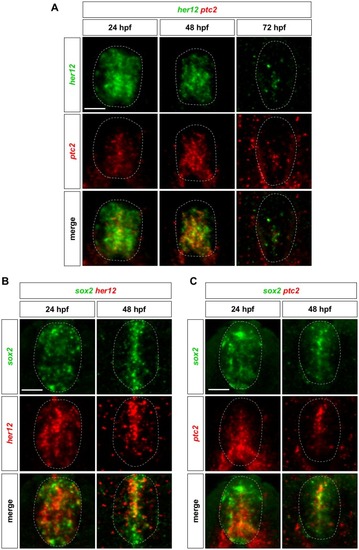
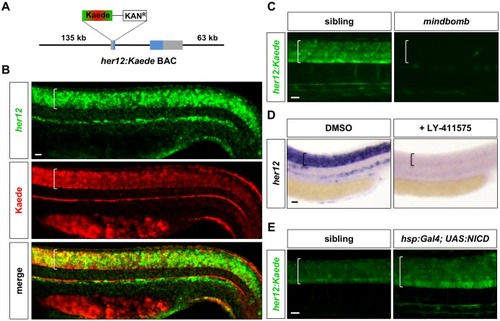
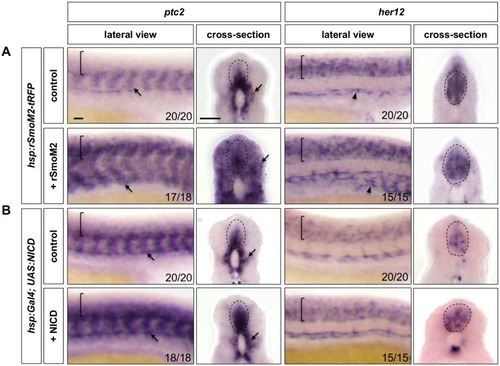
Whole-mount double fluorescent in situ hybridisation was performed in wild-type embryos for |
( |
( |
|
( |
( |
( |
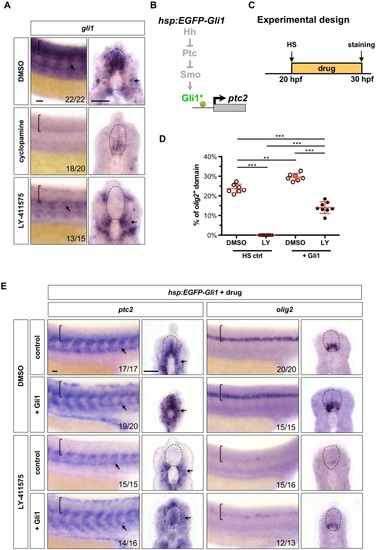
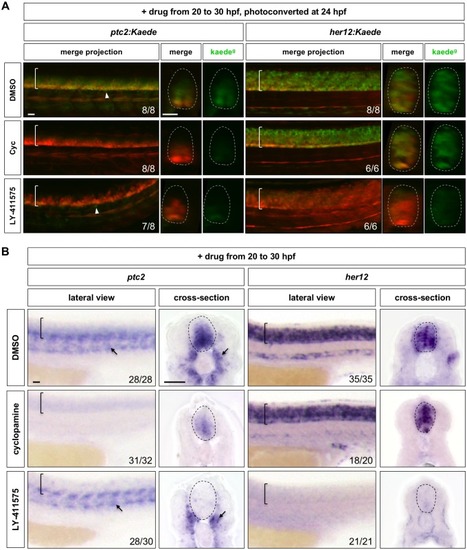
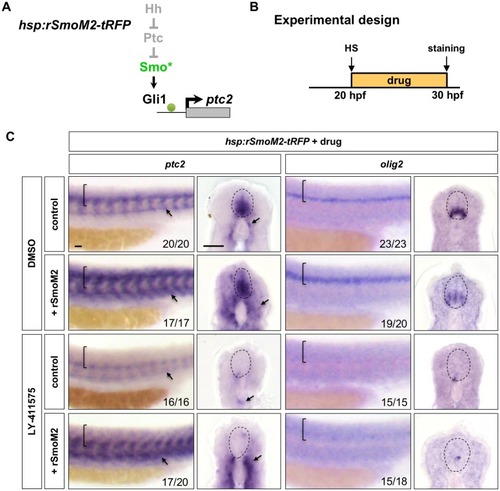
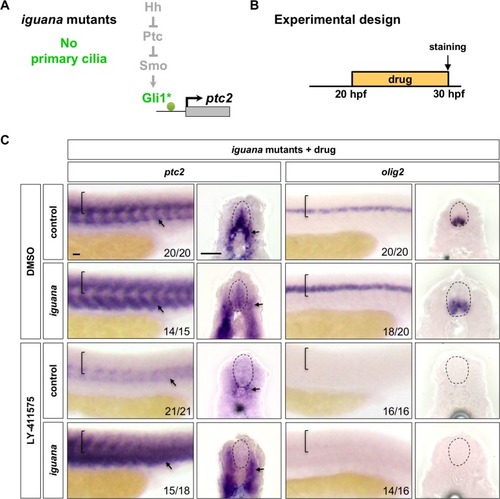
Wild-type embryos were treated with DMSO, cyclopamine, or LY-411575 from 20 to 30 hpf, and stained with |
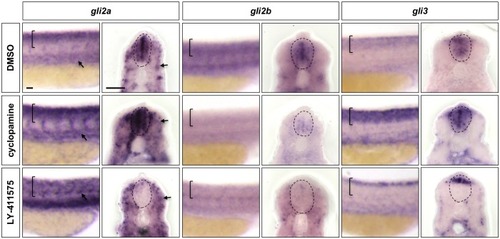
Wild-type embryos were treated with DMSO, cyclopamine, or LY-411575 from 20 to 30 hpf, and stained with |