
- Title
-
Glia-neuron interactions underlie state transitions to generalized seizures
- Authors
- Diaz Verdugo, C., Myren-Svelstad, S., Aydin, E., Van Hoeymissen, E., Deneubourg, C., Vanderhaeghe, S., Vancraeynest, J., Pelgrims, R., Cosacak, M.I., Muto, A., Kizil, C., Kawakami, K., Jurisch-Yaksi, N., Yaksi, E.
- Source
- Full text @ Nat. Commun.
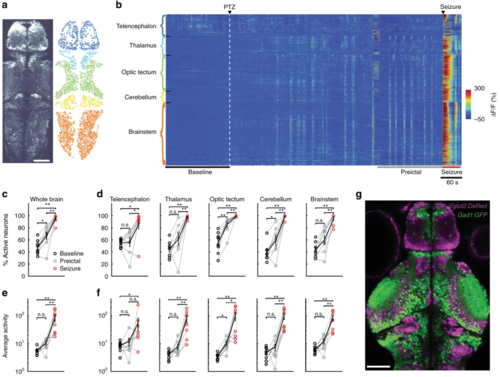
Brain regions are differentially recruited during epileptic activity. a An optical section of a zebrafish larva expressing GCaMP6sin all neurons, obtained by two-photon microscopy, dorsal view (left). Individual neurons (right) in color-coded brain regions: telencephalon (dark blue), thalamus (light blue), optic tectum (green), cerebellum (yellow), and brainstem (orange). b Activity of individual neurons (ΔF/F) over time, organized by brain region. White dashed line indicates the start of 20 mM pentylenetetrazole (PTZ) perfusion. Warmer colors indicate stronger activity. c, d Percentage of active neurons (>3stdbaseline) in the whole brain (c), and per brain area (d) during baseline (black), preictal (gray) and seizure periods (red). e, f Average activity of the active neurons, defined by the area under the curve of the ΔF/F trace, in the whole brain (e) and per brain area (f). g Confocal image of Tg(gad1:GFP);Tg(vglut2a:dsRED) double transgenic zebrafish larva showing glutamatergic (magenta) and GABAergic (green) neurons. White bars reflect 100 µm. **p = < 0.01, *p = < 0.05, ns = not significant, Wilcoxon signed-rank test. Error bars (c-f) represent the s.e.m. of n = 8 fish, where 2012.6 ± 238.7 (mean ± SEM) neurons/fish were analyzed |
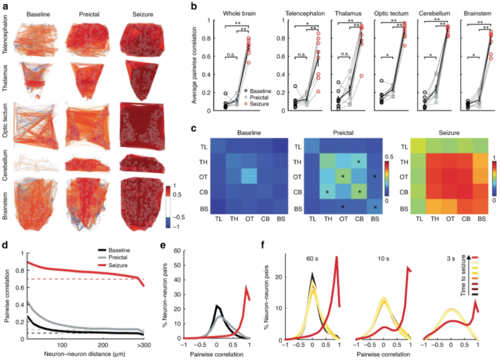
Functional connectivity between neurons changes abruptly from the preictal period to the generalized seizure. a A map depicting pairwise Pearson’s correlation coefficients of neural activity within brain regions during baseline, preictal and seizure periods. Each colored line indicates a strong positively (>0.5 in red) or negatively (<−0.5 in blue) correlated activity between pairs of neurons located at the end of the lines. b Average pairwise Pearson’s correlation during baseline (black), preictal (gray), and seizure (red) periods across the whole brain, and within individual brain regions. c Correlation matrices indicating average pairwise Pearson’s correlations of neural activity during baseline, preictal and seizure, across brain regions (telencephalon, TL; thalamus, TH; optic tectum, OT; cerebellum, CB; and brainstem, BS). Warmer colors indicate stronger positive correlations. d Relation between pairwise correlation of neural activity and distance between each neuron pair. Dotted lines represent the results when neural locations are shuffled. e Histogram representing the distribution of all correlation coefficients between neurons from all animals during baseline (black), preictal (gray), and seizure periods (red). fCorrelation coefficients during seven time periods immediately preceding a generalized seizure. The time periods are of 60, 10, and 3 s length, respectively. Lighter colors indicate temporal proximity to the seizure. **p = < 0.01, *p = < 0.05, ns = not significant, Wilcoxon signed-rank test. Error bars (b) and shaded regions (d–f) represent the s.e.m. of n = 8 fish |
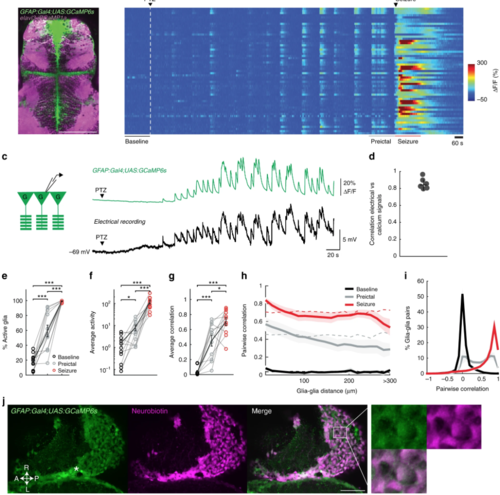
Glial cells are highly active and strongly synchronized already during preictal period. a Confocal image of a transgenic zebrafish larvae expressing GCaMP6s in GFAP positive glial cells (green) and jRCaMP1a in elavl3 positive neurons (magenta), dorsal view. b Glial calcium signals measured by two-photon microscopy in Tg(GFAP:Gal4)nw7;Tg(UAS:GCaMP6s) transgenic zebrafish larva. White dashed line indicates the start of 20 mM pentylenetetrazole (PTZ) perfusion. c Simultaneous patch-clamp recording of glial membrane potential and epifluorescence calcium recordings of Tg(GFAP:Gal4)nw7;Tg(UAS:GCaMP6s)transgenic zebrafish, during PTZ-induced epileptic activity. d Correlation of electrical activity and calcium signals from individual glial cells, n = 6 cells/zebrafish. e Percentage of active glial cells (>3stdbaseline) during baseline (black), preictal (gray), and seizure (red) periods. f Average activity of the active glial cells, defined by the area under the curve of the ΔF/F trace. gAverage pairwise Pearson’s correlation between glial cells. h Relation between pairwise correlation of glial activity and the distance between each glial pair. Dotted lines represent the results when glial locations are shuffled. i Histogram representing the distribution of the correlation coefficients between glial cells during baseline (black), preictal (gray) and seizure periods (red). j Confocal image showing GFAP positive radial glia expressing GCaMP6s (green) and neurobiotin coupling between glial cells (magenta) after filling a single glia with neurobiotin by patch-clamp electrode. Location of the patch-clamped glial cell is indicated with *. A, anterior; P, posterior; L, left; R, right. White bars reflect 100 µm (a, j). ***p = < 0.001, *p = < 0.05, ns = not significant, Wilcoxon signed-rank test. Error bars and shaded regions represent the s.d. of n = 6 cells (d) or s.e.m. of n = 11 fish (e–i) |
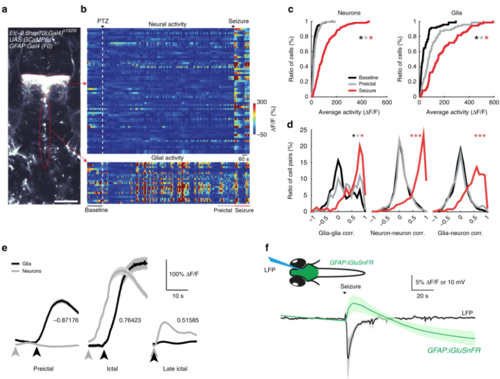
Functional interactions between glia and neurons change drastically during seizure generation. a An optical section of a transgenic zebrafish larva expressing GCaMP6s in thalamic neurons (top red dotted line) and GFAP expressing glial cells near the ventricles (bottom red dotted line) obtained by two-photon microscopy, dorsal view. White bar reflects 100 µm. b Activity (ΔF/F) of individual thalamic neurons (top) and glial cells along the ventricle (bottom). White dashed line indicates the start of 20 mM pentylenetetrazole (PTZ) perfusion. Warmer colors indicate stronger activity. c Cumulative distribution of neural (left) and glial activity (right) during baseline (black), preictal (gray) and seizure (red) periods, n = 71 glial cells and n = 171 neurons across four fish. d Histograms representing the distribution of all pairwise Pearson’s correlations for the activity of glia-glia pairs (left), neuron-neuron pairs (middle) and glia-neuron pairs (right). e Temporal relationship between average activity bursts of glia (black) and neurons (gray) during preictal and ictal state. Average Pearson’s correlation values between glial and neural activity bursts are indicated. f Scheme representing simultaneous local field potential (LFP) recording and epifluorescence imaging of a transgenic zebrafish larva expressing the glutamate sensor iGluSnFR (upper). The lower graph shows the average local field potential signals (black), and the average fluorescence intensity change (ΔF/F) for iGluSnFRsignals (green). Signals from multiple fish aligned at the onset of generalized seizure, n = 7 fish. ***p = < 0.001, *p = < 0.05, ns = not significant, Wilcoxon rank-sum test. Shaded regions denote se.m. of n = 4 fish (d, e) and n = 7 fish (f) |
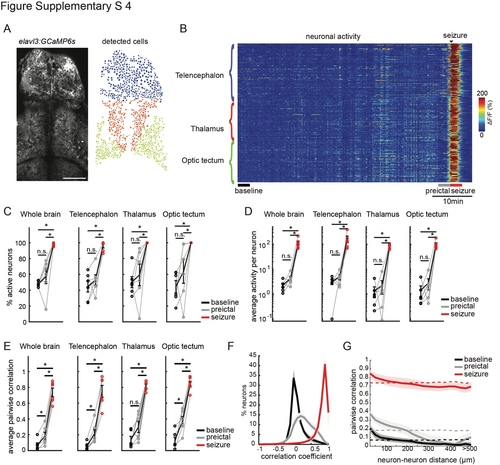
Pilocarpine-induced seizures exhibit features similar to pentylenetetrazole (PTZ)-induced seizures, but the ictogenesis occurs less rapidly A) An optical section of a zebrafish larva expressing GCaMP6s in all neurons, obtained by two-photon microscopy, dorsal view (left). Individual neurons (right) in color-coded brain regions: telencephalon (blue), thalamus (red), and optic tectum (green). White bar reflects 50 μm. B) Activity of individual neurons (ΔF/F) over time, organized by brain region. Application of 60 mM pilocarpine was done at the beginning of the recording. Baseline is indicated for a time period preceding strongly correlated activity. Warmer colors indicate stronger activity. C) Percentage of active neurons (>3stdbaseline) in the whole brain and per brain area during baseline (black), preictal (gray) and seizure (red) periods. D) Average activity of the active neurons, defined by the area under the curve of the ΔF/F trace, in the whole brain and per brain area. E) Average pairwise Pearson’s correlation across the whole brain, and within individual brain regions. F) Histogram representing the distribution of all correlation coefficients between neurons from all animals. G) Relation between pairwise Pearson’s correlation of neural activity and the distance between each neuron pair. Dotted lines represent the results when neuronal locations are shuffled. n = 6 fish. Shaded regions and error bars represent the s.e.m. (*p= <0.05, ns= not significant, Wilcoxon signed-rank test). |
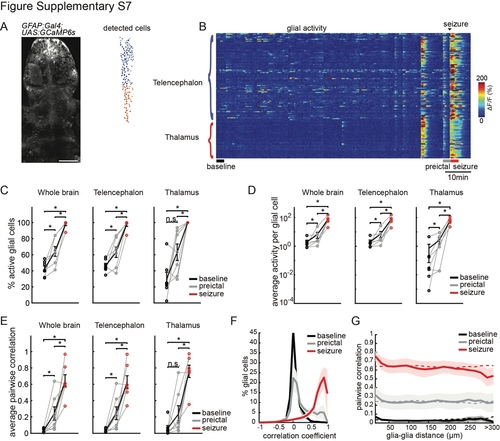
Pilocarpine-induced seizures are preceded by strong glial activity and synchrony, similar to pentylenetetrazole (PTZ)-induced seizures A) An optical section of a zebrafish larva expressing GCaMP6s in GFAP positive radial glia, obtained by two-photon microscopy, dorsal view (left). Individual glial cells (right) in color-coded brain regions: telencephalon (blue), and thalamus (red). White bar reflects 50 μm. B) Activity of individual glial cells (ΔF/F) over time, organized by brain region. Application of 60 mM pilocarpine was done at the beginning of the recording. Baseline is indicated for a time period preceding strongly correlated activity. Warmer colors indicate stronger activity. C) Percentage of active glial cells (>3stdbaseline) in the whole brain and per brain area during baseline (black), preictal (gray) and seizure (red) periods. D) Average activity of the active glial cells, defined by the area under the curve of the ΔF/F trace, in the whole brain and per brain area. E) Average pairwise Pearson’s correlation across the whole brain, and within individual brain regions. F) Histogram representing the distribution of all correlation coefficients between glial cells from all animals. G) Relation between pairwise Pearson’s correlation of glial activity and the distance between each glia pair. Dotted lines represent the results when glial locations are shuffled. n=7 fish. Shaded regions and error bars represent the s.e.m. (*p= <0.05, ns= not significant, Wilcoxon signed-rank test). |