
- Title
-
Cadherin-Mediated Cell Coupling Coordinates Chemokine Sensing across Collectively Migrating Cells
- Authors
- Colak-Champollion, T., Lan, L., Jadhav, A.R., Yamaguchi, N., Venkiteswaran, G., Patel, H., Cammer, M., Meier-Schellersheim, M., Knaut, H.
- Source
- Full text @ Curr. Biol.
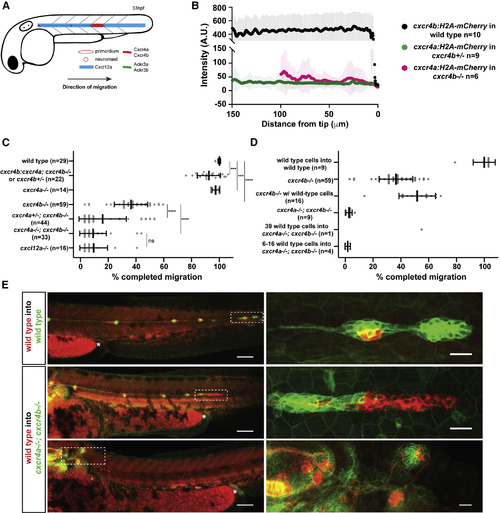
A small Number of Cxcr4-Expressing Cells Cannot Restore Migration of Primordia Lacking Cxcr4 Activity (A) Schematic of primordium migration and chemokine signaling system in primordium. (B) Fluorescent intensity quantification of cxcr4b transcriptional reporter in wild-type primordia (black) and cxcr4a transcriptional reporter in cxcr4bheterozygous (green) and cxcr4b mutant primordia (pink) in 33–36 hpf embryos. Fluorescent intensities were averaged along the front-to-back axis of the primordia. Mean, SD, and n are indicated. (C) Quantification of primordium migration in 48 hpf embryos of indicated genotypes. Note that the cxcr4b:cxcr4a embryos originated from a cross that yielded on average 50% cxcr4b−/− and 50% cxcr4b+/− embryos. Grey dots represent individual data points. Sample size is as indicated. Vertical and horizontal black lines indicate mean and SD, respectively. ∗∗∗ = p < 0.001, ∗∗∗∗ = p < 0.0001; ns, not significant (Mann-Whitney test). (D) Quantification of the migration defects in cxcr4 mutants and degree of migration restoration in chimeric primordia. Note that the number of wild-type cells for the chimeras includes wild-type cells in the neuromasts and the primordium. (E) Sum projections of fixed chimeric embryos of indicated genotypes at 48 hpf. Magnifications of primordia in left panels indicated by dashed white rectangles are shown in the panels on the right. The asterisks mark the yolk extension. Scale bars in left and right panels correspond to 100 μm and 20 μm, respectively. See also Figure S1 and Methods S2.
|
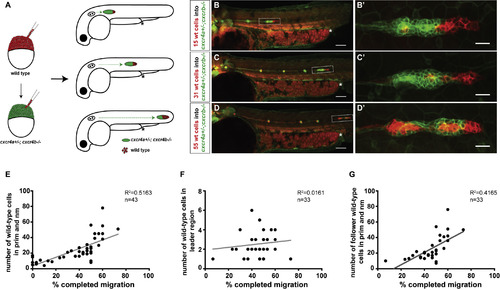
Cxcr4-Deficient Primordia Migrate Farther with Increasing Number of Wild-Type Cells (A) Experimental design and predictions for migratory behavior of cxcr4-deficient primordia with increasing number of wild-type cells. (B–D) Sum projections of 48 hpf embryos with chimeric primordia. Wild-type donor-derived cells in primordia are labeled in red with prim:lyn2mCherry and cxcr4a+/−; cxcr4b−/− host-derived cells are labeled in green with cldnB:lyn2GFP (B–D), and magnifications of chimeric primordia are outlined with rectangles in (B–D) (B’–D’). Chimeric primordia migrate further as the number of wild-type donor cells increases in the cxcr4a+/−; cxcr4b−/− primordia. The chimeric primordia are outlined with dashed rectangles, and asterisks mark the end of the yolk extension in (B–D). Scale bars in (B–D) and (B’–D’) represent 100 μm and 20 μm, respectively. (E) Graph of the migration distance of cxcr4-deficient primordia versus the total number of wild-type cells in the chimeric primordia (total number of wild-type cells includes neuromast [nm] cells and primordium [prim] cells). (F) Graph of wild-type cell number in the leader cell region (first 15 microns of the front of the primordium as defined in [31]) versus migration distance of cxcr4-deficient chimeric primordia. (G) Graph of the number of wild-type cells in the follower cell region (past 15 microns from the front of the primordium as defined in [31]) versus migration distance of cxcr4-deficient chimeric primordia. See also Figure S2 and Methods S2. n indicates the number of chimeric primordia in (E–G).
|
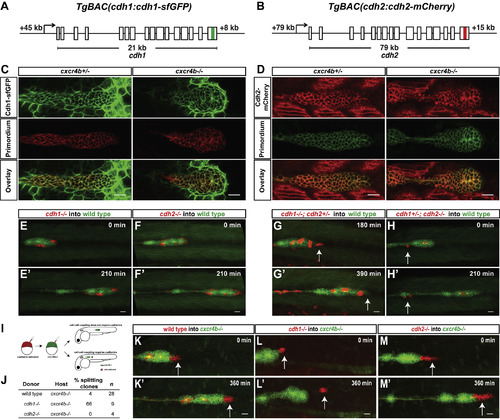
Cadherin-Mediated Adhesion Couples the Cells in the Primordium (A and B) Schematic diagrams of BAC transgenes that drive expression of Cdh1-sfGFP and Cdh2-mCherry. (C) Single confocal section through primordium in live prim:lyn2-mCherry; cdh1:cdh1-sfGFP embryos heterozygous (left) and mutant for cxcr4b (right) at 36 hpf. (D) Single confocal section through primordium in live cldnB:lyn2-GFP; cdh2:cdh2-mCherry embryos heterozygous (left) and mutant for cxcr4b (right) at 36 hpf. The scale bar represents 20 μm. See also Video S1. (E–H) Sum projections of time-lapse videos of wild-type primordia (green) with clones of cdh1−/− (E), cdh2−/− (F), cdh1−/−; cdh2−/+ (G), and cdh1−/+; cdh2−/−(H) primordium cells (red). The time-lapse videos start at 33 hpf (E), 28 hpf (F and H), and 31 hfp (G) and stop at the indicated lapsed times. Arrows in (G) and (H) indicate mutant cells on the edge of the primordium that fail to co-migrate with their wild-type neighbors. The scale bar represents 20 μm. Images correspond to frames 1 and 8 (E, F, and H) and frames 7 and 14 (G) in Video S2. (I) Experimental design and predictions for the cadherin mutant cells’ ability to rescue the cxcr4b mutant primordia migration defect. (J) Table summarizing the chimeric analysis of cadherin-deficient cells in cxcr4b mutant primordia. Genotypes of donor clones and host primordia, percentage of chimeric primordia in which donor cells split from the host cells, and sample number are indicated. (K–M) Sum projections of time lapse videos of cxcr4b mutant primordia (green) with clones of wild-type control (K), cdh1−/− (L), and cdh2−/− (M) primordium cells (red). The time-lapse videos start at 33–34 hpf and stop at the indicated lapsed times. Arrows indicate wild-type (K) and mutant (L and M) cells in the front of the primordium. The scale bar represents 20 μm. Images correspond to frames 1 and 13 in Video S2. See also Figure S3; Videos S1 and S2; and Methods S1. |
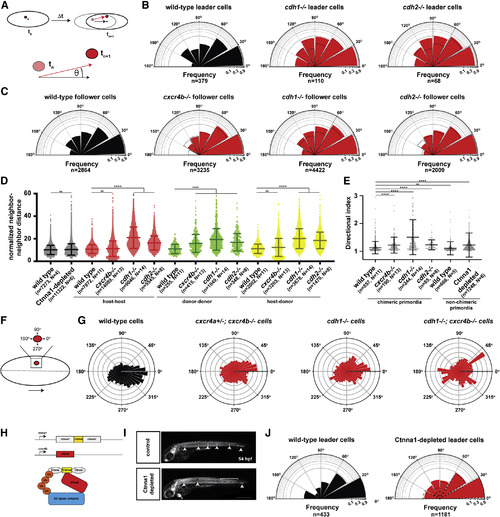
Chemokine Signaling and Cadherin-Mediated Adhesion Provide Directionality to the Cells in the Primordium (A) Schematic diagrams of nuclear tracking of primordium cells. The directional angle (θ) was calculated as the angle between the averaged displacement vector of the primordium (black arrow) and the displacement vector of each cell nucleus in the primordium (red arrow) between two consecutive time points, tn and tn+1, in 3-dimensional space. For perfectly aligned cells, the directional angle will be zero, and for cells migrating in the opposite direction of the primordium, the directional angle will be 180 degrees. (B) Semi-circular histogram plots of the directional angle frequencies (binned in 30-degree intervals) of wild-type (left), cdh1 mutant (middle), and cdh2 mutant leader cells (right) in wild-type primordia. For the wild-type directional angles, donor and host leader cell directional angles were pooled. Note that cxcr4b mutant cells do not occupy leader cell positions in wild-type primordia, and directional angles cannot be determined. Dashed lines indicate directional angle frequencies of the wild-type leader cells. The frequencies on the radial axes are plotted on a log10-scale. n indicates the number of directional angles. The directional angle distributions for wild-type and cdh1 mutant leader cells (p = 0.0003) and wild-type and cdh2mutant leader cells (p = 0.0015) are significantly different (Kolmogorov-Smirnov test). (C) Semi-circular histogram plots of the directional angle frequencies (binned in 30-degree intervals) of wild-type (far left), cxcr4b mutant (middle left), cdh1 mutant (middle right), and cdh2 mutant follower cells (far right) in wild-type primordia. Dashed lines indicate directional angle frequencies of the wild-type follower cells. The frequencies on the radial axes are plotted on a log10-scale. n indicates the number of directional angles. The directional angle distributions for wild-type and cxcr4b mutant follower cells (p = 0.0075), wild-type and cdh1 mutant follower cells (p < 0.0001), and wild-type and cdh2 mutant follower cells (p = 0.0032) are significantly different (Kolmogorov-Smirnov test). (D) Normalized neighbor-neighbor distances for wild-type and Ctnna1-depleted primordia (black) and host-host (red), donor-donor (green), and host-donor (yellow) chimeric primordia. For chimeric primordia, all host cells were wild type, and the genotypes of the donor cells are indicated. Cells were defined as neighbors if the initial distance between a pair of cells was smaller than 15 μm. The distance between such pairs was tracked for 11 time intervals (22 min). The neighbor-neighbor distances were normalized to the average speed of the primordium cells. Mean and standard deviation are indicated. n is the number of cell pairs, and N is the number of embryos analyzed. ns indicates p > 0.05, and ∗∗∗∗ indicates p < 0.0001 (Kruskal-Wallis one-way analysis of variance). (E) Directional indices of donor cells of indicated genotypes in wild-type host primordia and directional indices of wild-type cells and Ctnna1-depleted cells. Note that the directional indices of the host and donor cells are pooled for chimeric primordia with wild-type donor and wild-type host cells. Directional indices were calculated for a track length of 18 time intervals (36 min). Mean and standard deviation are indicated. n is the number of cell tracks, and N is the number of embryos analyzed. ns indicates p > 0.05, and ∗∗∗∗ indicates p < 0.0001 (Kruskal-Wallis one-way analysis of variance). (F) Schematic diagram of donor cell clone (red) location and protrusive activity angle distribution with respect to the primordium midline and direction of migration. The dashed line indicates the primordium midline in AP axis, and the large arrow indicates the direction of migration. Protrusive activity toward 0 degrees is in the direction of migration, and protrusive activity toward 270 degree is toward the midline of the primordium and the underlying cxcl12a-expressing cells. (G) Circular histogram plots of protrusive activity frequencies of donor-derived wild-type cells (far left, n = 8), cxcr4a+/−; cxcr4b−/− cells (middle left, n = 8), cdh1−/− cells (middle right, n = 5), and cdh1−/−; cxcr4b−/− cells (far right, n = 2) in wild-type primordia. The distributions of the protrusive activities for wild-type cells and the mutant (cxcr4a+/−; cxcr4b−/−, cdh1−/− or cdh1−/−; cxcr4b−/−) cells are significantly different (p < 0.0001, Kolmogorov-Smirnov test). (H) Schematic depiction of ctnna1:ctnna1-Citrine locus, cxcr4b:zGradtransgene and principle of zGrad-mediated Ctnna1-Citrine depletion. (I) Tiled and sum-projected Z stacks of ctnna1:ctnna1-Citrine/ctnna1:ctnna1-Citrine; prim:lyn2-mCherry embryo (top) and ctnna1:ctnna1-Citrine/ctnna1:ctnna1-Citrine; prim:lyn2-mCherry; cxcr4b:zGrad embryo (bottom). For clarity, only the mCherry signal is shown. Arrowheads, bracket, and asterisk indicate neuromasts, shed primordium cells, and mScarlet expression in the heart from the transgenesis marker on the cxcr4b:zGrad BAC transgene, respectively. Scale bar, 0.5 mm. (J) Semi-circular histogram plots of the directional angle frequencies (binned in 30-degree intervals) of leader cells in wild-type (left) and Ctnna1-depleted (right) primordia. Dashed lines indicate directional angle frequencies of the wild-type leader cells. The frequencies on the radial axes are plotted on a log10-scale. n indicates the number of directional angles. The directional angle distributions for wild-type and Ctnna-depleted leader cells are not significantly different (p = 0.3454, Kolmogorov-Smirnov test). See also Figure S4; Videos S3 and S4; and Methods S3 and S4. |