
- Title
-
Lineage tracing of col10a1 cells identifies distinct progenitor populations for osteoblasts and joint cells in the regenerating fin of medaka (Oryzias latipes)
- Authors
- Dasyani, M., Tan, W.H., Sundaram, S., Imangali, N., Centanin, L., Wittbrodt, J., Winkler, C.
- Source
- Full text @ Dev. Biol.
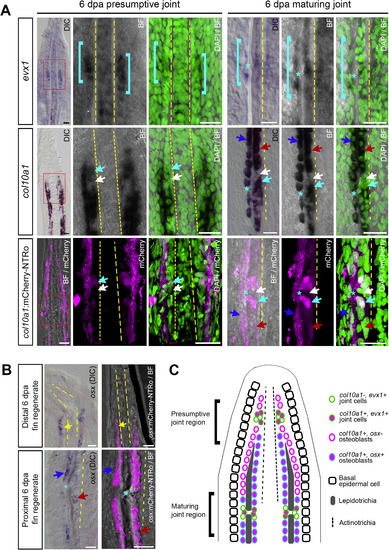
Expression of evx1, col10a1, osx, col10a1:mCherry-NTRo and osx:mCherry-NTRo in the adult medaka fin. A: Comparison of endogenous evx1 and col10a1 expression by RNA in situ hybridization and transgenic col10a1:mCherry-NTRo expression in the presumptive joint region and maturing joint region of 6 dpa fin regenerates (20 μm longitudinal sections). Endogenous col10a1 expression and col10a1:mCherry-NTRo expression mark a subset of evx1-positive joint cells (cyan arrows, n = 3 fin rays, 3 fish). Cyan brackets indicate domains of evx1-positive joint cells, asterisks mark joints, yellow dotted lines mark the actinotrichia, cyan arrows mark col10a1 expression in joint cells, white arrows mark absence of expression in joint cells, dark blue arrows mark the outer row of osteoblasts, red arrows mark the inner row of osteoblasts. B: Comparison of endogenous osx expression by RNA in situ hybridization and transgenic osx:mCherry-NTRo expression in distal and proximal regions of 6 dpa fin regenerates (20 μm longitudinal sections). osx:mCherry-NTRo expression recapitulates endogenous osx expression, marking a single row of osteoblasts (yellow arrows) per hemiray at the distal fin regenerate and two rows of osteoblasts (dark blue and red arrows) per hemiray in the proximal regenerate (n = 3 fin rays, 3 fish). Scale bars = 20 μm. C: Schematic diagram indicating expression patterns of evx1, col10a1, and osx in joint cells and osteoblasts at the distal region of a 6 dpa fin regenerate in a longitudinal section view. |
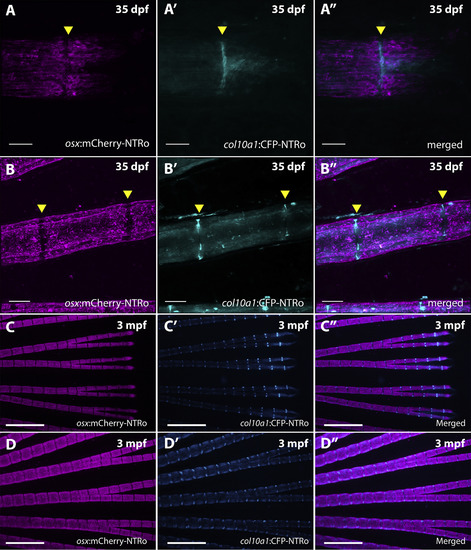
Expression of col10a1:CFP-NTRo and osx:mCherry-NTRo in the juvenile and adult caudal medaka fin. A-B: Confocal images of distal (A) and proximal (B) regions in caudal fins of osx:mCherry-NTRo/col10a1:CFP-NTRo double transgenic medaka at 35 dpf showing mCherry expression in osteoblasts (A,B), CFP expression in osteoblasts and joint cells (A′, B′) and merged images (A″, B″). Scale bars = 40 μm. C-D: Distal (C) and proximal (D) regions in caudal fins of osx:mCherry-NTRo/col10a1:CFP-NTRo double transgenic medaka at 3 mpf. Scale bar = 0.5 mm. |
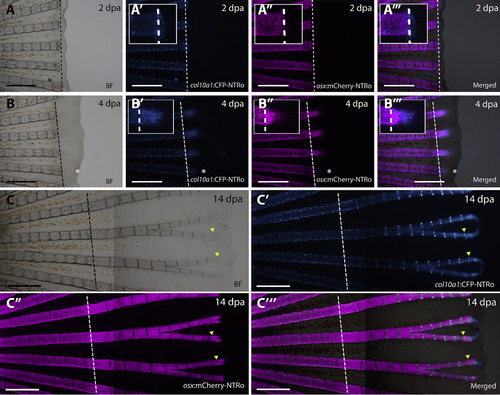
Expression of col10a1:CFP-NTRo and osx:mCherry-NTRo during fin regeneration. Images of regenerating fin at 2 (A), 4 (B) and 14 (C) days post amputation (dpa) showing bright field images (A, B, C), CFP expression (A′, B′, C′), mCherry expression (A″, B″, C″) and merged images (A‴, B‴, C″, C‴). Insets in (A,B) show higher magnification views of individual blastema regions indicated by asterisks (in B-B’’’). Dotted line indicates amputation plane. Scale bars = 0.5 mm. |
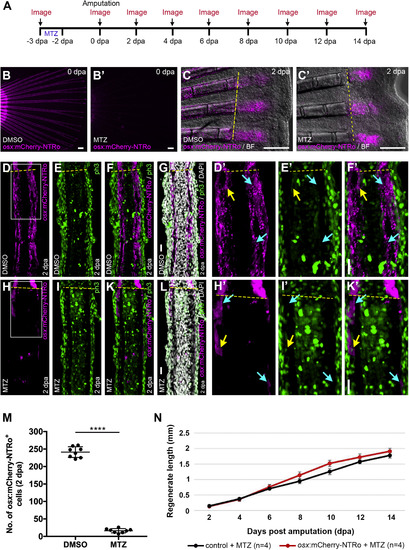
Osx:mCherry-NTRo cell ablation in the adult medaka fin does not affect rate of regenerative outgrowth. A. Strategy for ablation of osx-positive cells in medaka. Mtz, period of treatment with metronidazole. B, C: Transgenic osx:mCherry-NTRo fin showing osx:mCherry-NTRo expression after DMSO treatment (control; B, C) and Mtz treatment (B′, C′) at 0 dpa and 2 dpa. Scale bars in B, B′, C, C’ = 200 μm. D-L: ph3 and DAPI staining on 20 μm longitudinal fin sections of DMSO-treated (D-G) and Mtz-treated (H-L) osx:mCherry-NTRo fish at 2 dpa. D′, E′ F′: Magnified views of the boxed region in (D). H′, I′, K′: Magnified views of the boxed region in (H). Yellow dotted lines indicate the amputation plane, yellow arrows indicate mCherry/ph3-double positive cells, cyan arrows indicate mCherry-positive, ph3-negative cells. Scale bars in G, F′, L, K’ = 20 μm. M: Number of osx:mCherry-NTRo-expressing cells (300 μm from the amputation plane) is significantly reduced (93.3%) in Mtz treated fish (16.3 ± 6.1) compared to DMSO controls (241.3 ± 15.3) at 2 dpa. Error bars indicate mean ± s.d. Cell count was performed on confocal z-stack images of 20 μm longitudinal sections, n = 8 fin rays (N = 6 fish). N: Lengths of fin regenerates after osx cell ablation. Double transgenic col10a1:nlGFP/osx:mCherry-NTRo (osx:mCherry-NTRo) and osx:mCherry-NTRo negative siblings (control) treated with Mtz show similar rates of fin outgrowth. Data are represented as mean ± SEM. Changes are not significant. |
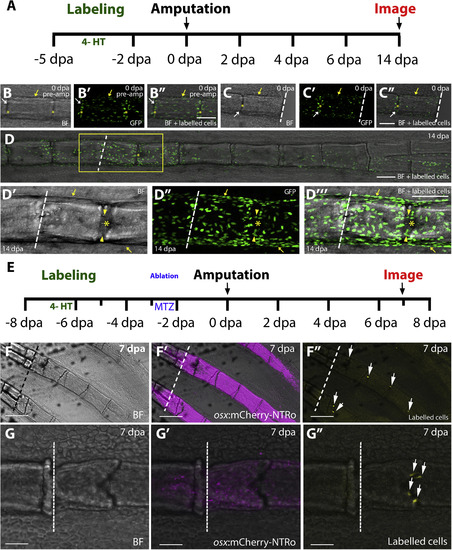
Contribution of col10a1 cells to the regenerating fin. A: Strategy employed for Gaudi (Cre-loxP)-mediated lineage tracing of col10a1 cells in the regenerating fin. Cre-induced recombination is triggered by incubating fish in 4-hydroxytamoxifen (4-HT) for three days starting at -5 dpa. B-C: Confocal images of GFP-labelled col10a1 cells in GaudíRSG fish at 0 dpa, before amputation (B, B′, B″) and after amputation (C, C′, C″). White arrows indicate labelled joint cells, yellow arrows indicate labelled segmental cells. D-D‴: Overview (D) and magnified confocal images of boxed region (D′-D‴) showing contribution of labelled col10a1 cells to segments (arrows, bone lining cells) and intersegmental joint regions (arrowheads) at 14 dpa (n = 14 fin rays, 5 fish). Asterisks indicate joints, dotted lines indicate the amputation plane. Scale bars = 100 μm. E: Strategy employed for col10a1 cell lineage tracing after osx cell ablation. F-G: Overview (F; scale bars = 200 μm) and magnified confocal images (G; scale bars = 50 μm) of re-emerged osx:mCherry-NTRo cells (F′, G′) and YFP labelled col10a1 cells (F″, G″) at 7 dpa showing contribution of labelled cells exclusively to joints (arrows). Dotted lines indicate the amputation plane. BF = brightfield. |
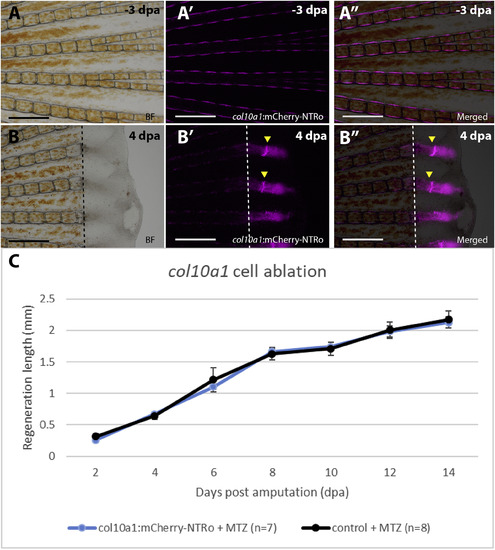
Fin regeneration after col10a1 cell ablation. A,B: Images of fins before treatment (A) and regenerates at 4 dpa (B) showing bright field (A,B), col10a1:mCherry-NTRo expressing cells (A′,B′) and merged images (A″,B″). Arrowheads indicate col10a1:mCherry-NTRo positive cells in the regenerating intersegmental region. Scale bars = 0.5 mm. C: Average lengths of regenerates at different time points. Col10a1 cell ablated fish show a similar rate of fin regeneration as compared to control siblings treated with Mtz. Data are represented as mean ± SEM. |
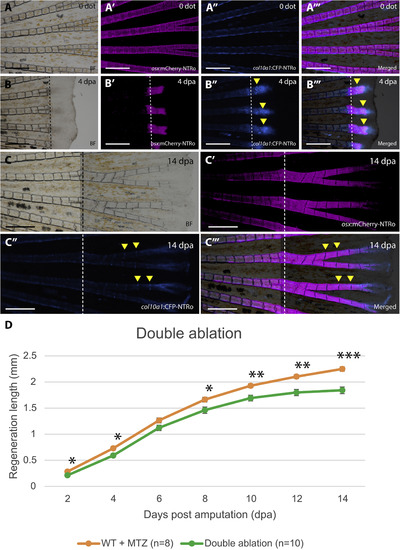
Fin regeneration after double ablation of osx and col10a1 cells. A,B: Images of fins before double ablation (A) and in regenerates at 4 dpa (B) showing bright field (A,B), osx:mCherry-NTRo (A′,B′), col10a1:CFP-NTRo (A″,B″), as well merged images (A‴,B‴). Dotted lines indicate amputation planes. Scale bars = 0.5 mm. C: Fins at 14 dpa. Image arrangement as in A and B. D: Length of fin regenerates after double ablation of osx and col10a1 cells. At 14 dpa, fins depleted of osx and col10a1-positive cells show a 19% reduction in the length of regenerates as compared to wild-type control fish treated with Mtz (*P < 0.05; **P < 0.005; ***P< 0.0001). Data are represented as mean ± SEM. |
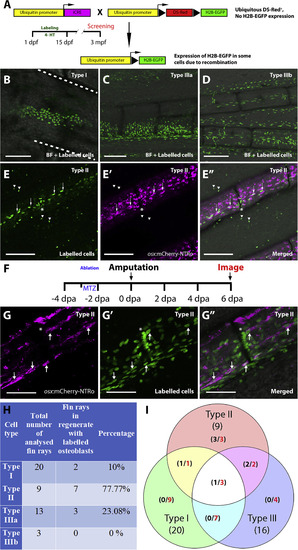
Lineage tracing of randomly labelled cells identifies sources for osteoblast regeneration. A: Strategy for labelling different cell lineages by 4-HT incubation at embryonic and post-hatching stages (1 – 15 dpf) and detection of labelled cells in the adult fin (3 mpf). Triangle represents loxP sites. B-E’‘: Confocal images of adult fins at 3 mpf showing labelling of different cell types (identities were predicted based on position and morphology; see Tu and Johnson, 2011): Type I (epidermal and blood cells, B), Type IIIa (intraray fibroblasts; C) and Type IIIb (endothelial cells; D). The panel in E shows Type II cells (osteoblasts) that co-express osx:mCherry-NTRo (E′), as evident in merged image (E”; EGFP, mCherry and brightfield merged images). Dashed white lines in B indicate borders of fin rays. Arrowheads indicate GFP signal outside the fin rays of unclear origin. Scale bars = 100 μm. F: Timeline for osx cell ablation, amputation and imaging of labelled cells in the regnerating fin. G: Representative confocal images showing osx:mCherry-NTRo expressing osteoblasts (G), lineage traced type II cells (G′), and merged image at 6 dpa. Note osx expression in some of the labelled cells (arrows). Asterisks label the intersegmental regions. Scale bars = 100 μm. H,I: Table (H) and Venn diagram (I) showing contribution of different classes of labelled cells (Types I to III) to the osteoblast lineage. Numbers in red indicate total number of fin rays positive for particular cell type, numbers in black indicate fin rays with contribution to osteoblasts (after ablation) per number of analysed fin rays. |
Reprinted from Developmental Biology, 455(1), Dasyani, M., Tan, W.H., Sundaram, S., Imangali, N., Centanin, L., Wittbrodt, J., Winkler, C., Lineage tracing of col10a1 cells identifies distinct progenitor populations for osteoblasts and joint cells in the regenerating fin of medaka (Oryzias latipes), 85-99, Copyright (2019) with permission from Elsevier. Full text @ Dev. Biol.