
- Title
-
Label-free neuroimaging in vivo using synchronous angular scanning microscopy with single-scattering accumulation algorithm
- Authors
- Kim, M., Jo, Y., Hong, J.H., Kim, S., Yoon, S., Song, K.D., Kang, S., Lee, B., Kim, G.H., Park, H.C., Choi, W.
- Source
- Full text @ Nat. Commun.
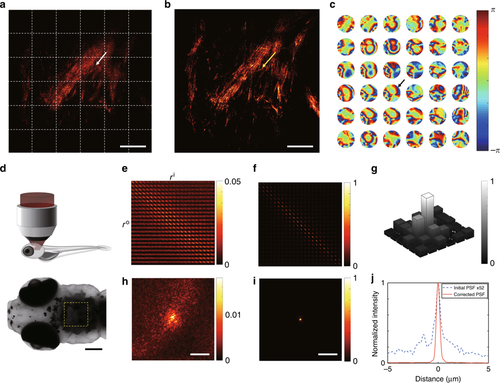
Correction of local position-dependent aberrations for in vivo neuroimaging. aReconstructed image of SASM before the aberration correction. The white dotted boxes show segmented areas where aberration correction was individually applied. bAberration-corrected image of AO-SASM. The scale bar represents 20 μm (a, b). c Local aberration maps in the pupil plane corresponding to the segments divided by the white dashed boxes in (a). Color bar, phase retardation in radians. The radius of each aberration map is 𝑘0×NAk0×NA, where 𝑘0k0 is the magnitude of the free-space wavevector. dImaging configuration. A 21-dpf zebrafish was placed under the objective lens at an upright position after being anesthetized, and the area close to the ear in the hindbrain was investigated. The dorsal view of the zebrafish taken by a bright-field microscope is shown below. The dark area in the yellow dashed box is due to the pigmented scales at the skin. The scale bar represents 200 μm. e, f Amplitude maps of the time-gated reflection matrices for the segment indicated by a white arrow in (a) before and after aberration correction, respectively. g Normalized cross-correlation between aberration maps in their complex pupil functions with respect to the aberration map indicated by a black arrow in (c). h, i PSFs derived from (e, f), respectively. The color bars in (e, f, h, i) represent the intensity normalized by the maximum value of the corrected PSF in (i). The scale bar represents 5 μm (h, i). j Line profiles of PSFs obtained from h (blue dotted curve) and i (red solid curve). The PSF from (h) was multiplied by the factor of 52
|
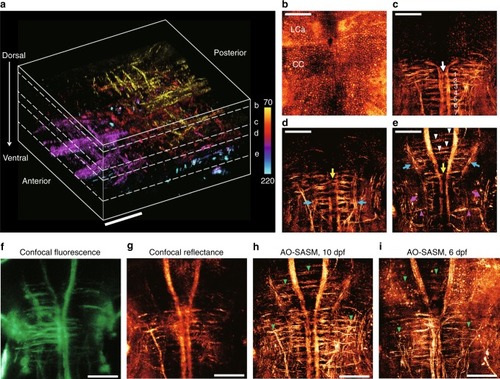
3D neuroanatomy encompassing the deep hindbrain of a living zebrafish. a 3D rendering of the aberration-corrected tomographic images ranging from 70 to 220 μm in depth at the hindbrain of a 10-dpf larval zebrafish. The wavelength of the light source was 633 nm. The scale bar represents 50 μm. Color bar indicates depth from the surface. b–eMIP images at a depth centered on each plane indicated by the white dashed lines in (a). The scale bar represents 50 μm. b The en-face cellular distributions. MIP image ranging from 70 to 75 μm in dorsal depth. c The subset of neural networks. MIP image in the depth range of 112.5 to 135 μm. The white arrow indicates the crossed axons of Mauthner cells, and the labels ranging from 1 to 7 indicate a series of seven ladder-like commissural tracts in the caudal hindbrain. d MIP image ranging from 135 to 145 μm. eMIP image ranging from 150 to 220 μm. The yellow arrows in (d, e) indicate two prominent commeasures in rhombomere 3. The blue arrows indicate the ipsi- and contra-lateral projections. The white arrowheads in (e) indicate commissural tracts connected to the anterior medial projections. The magenta arrows and arrowheads in e indicate torus semi-circularis and interneuron projections, respectively. f–h MIP images of confocal fluorescence (f), confocal reflectance (g), and AO-SASM (h) for the same zebrafish shown in (a). i MIP image retrieved by AO-SASM for a 6-dpf larval zebrafish. Green arrowheads in (h, i) indicate commissural tracts connecting between medial and lateral projections. The scale bar represents 50 μm. LCa lobus caudalis cerebella, CC crista cerebellaris
|