
- Title
-
The Serotonergic Raphe Promote Sleep in Zebrafish and Mice
- Authors
- Oikonomou, G., Altermatt, M., Zhang, R.W., Coughlin, G.M., Montz, C., Gradinaru, V., Prober, D.A.
- Source
- Full text @ Neuron
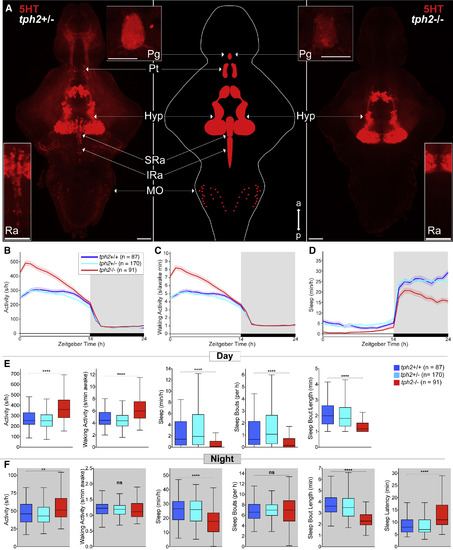
tph2−/− Zebrafish Are More Active and Sleep Less (A) Maximum intensity projections of 5 days post-fertilization (dpf) tph2+/− (left) or tph2−/− (right) zebrafish brains immunostained for 5-HT. Middle: brain schematic. Top insets: 5-HT immunostaining of the pineal gland. Bottom insets: magnified view of the raphe. Scale bars, 50 μm. a, anterior; p, posterior; Pg, pineal gland; Pt, pretectal area; Hyp, hypothalamus; Ra, raphe; SRa, superior raphe; IRa, inferior raphe; MO, medulla oblongata. (B–D) Activity (B), waking activity (C), and sleep (D) for tph2+/+ (blue), tph2+/− (cyan), and tph2−/− (red) zebrafish. Line and shading represent mean ± SEM. (E and F) Activity, waking activity, sleep, sleep bout number, sleep bout length during day (E) and night (F), and sleep latency at night (F). n, number of animals. Not significant (ns) p > 0.05, ∗p < 0.05, ∗∗p < 0.01, ∗∗∗p < 0.001, ∗∗∗∗p < 0.0001, Kruskal-Wallis test with Dunn’s multiple comparisons test. |

ZFIN is incorporating published figure images and captions as part of an ongoing project. Figures from some publications have not yet been curated, or are not available for display because of copyright restrictions. |
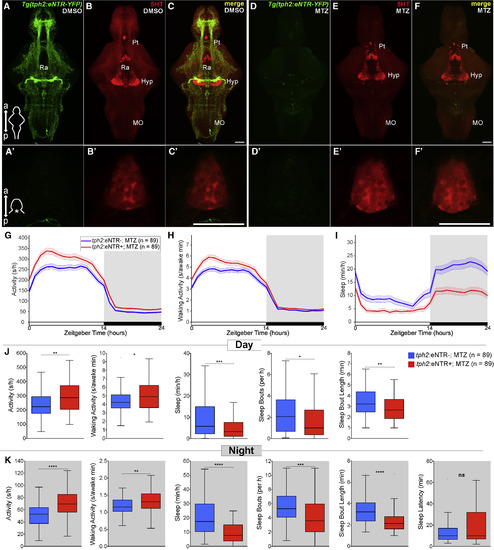
Chemogenetic Ablation of the Raphe Results in Decreased Sleep in Zebrafish (A–F′) Maximum intensity projections of brains (A–F) and single plane images of pineal glands (A′–F′) from 5 dpf Tg(tph2:eNTR-YFP) zebrafish treated with DMSO vehicle (A–C and A′–C′) or MTZ (D–F, D′–F′), and immunostained for 5-HT and YFP. Scale bars, 50 μm. a, anterior; p, posterior; Pt, pretectal area; Hyp, hypothalamus; Ra, raphe; MO, medulla oblongata. (G–I) Activity (G), waking activity (H), and sleep (I) for 5 dpf Tg(tph2:eNTR-YFP) (red) and non-transgenic sibling control (blue) zebrafish treated with MTZ. Line and shading represent mean ± SEM. (J and K) Activity, waking activity, sleep, sleep bout number, sleep bout length during day (J) and night (K), and sleep latency at night (K). n, number of animals. ns p > 0.05, ∗p < 0.05, ∗∗p < 0.01, ∗∗∗p < 0.001, ∗∗∗∗p < 0.0001, Mann-Whitney test. |
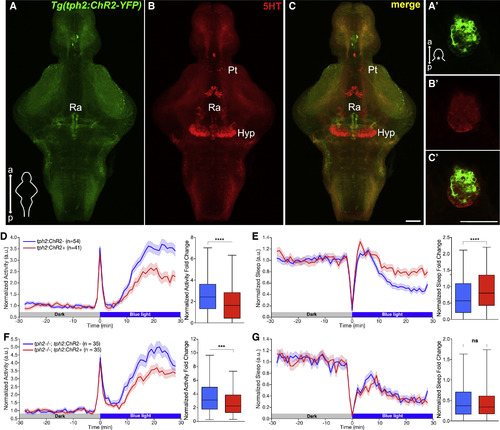
Optogenetic Stimulation of the Raphe Results in Reduced Locomotor Activity and Increased Sleep in Zebrafish (A–C′) Maximum intensity projections of brains (A–C) and single plane images of pineal glands (A′–C′) from 5 dpf Tg(tph2:ChR2-YFP) zebrafish immunostained for 5-HT and YFP. Scale bars, 50 μm. a, anterior; p, posterior; Pt, pretectal area; Hyp, hypothalamus; Ra, raphe. (D and E) Left: normalized locomotor activity (D) and sleep (E) of 5 dpf Tg(tph2:ChR2) (red) and non-transgenic sibling control (blue) zebrafish before and during exposure to blue light. Right: normalized locomotor activity (D) and sleep (E) fold change during illumination. (F and G) Same as (D) and (E) but in tph2−/− animals. n, number of animals; 6 trials per animal. ns p > 0.05, ∗∗∗p < 0.001, ∗∗∗∗p < 0.0001, Mann-Whitney test. |
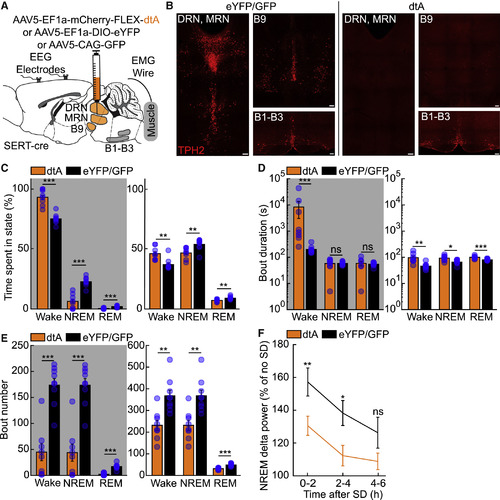
Ablation of Murine Raphe Leads to Increased Wakefulness and Impairs the Homeostatic Response to Sleep Deprivation (A) Experimental setup. (B) Representative images of TPH2+ neurons (red) from SERT-cre mice injected with either AAV5-EF1a-DIO-eYFP (left) or AAV5-EF1a-mCherry-FLEX-dtA (right). Scale bar, 100 μm. (C) Percentage of time spent in the wake, NREM, and REM states during the dark (gray shading) and light phase from 24 h polysomnographic recordings. (D and E) Duration (D) and number (E) of wake, NREM, and REM bouts during the dark and light phase. (F) Change in delta power across NREM episodes in animals subjected to 6 h of sleep deprivation (SD) at the beginning of the light phase compared to undisturbed sleep from previous light phase (no SD). n = 8 for B5-B9SERT-dtA, n = 9 for B5-B9SERT-eYFP or B5-B9GFP, two-sided Wilcoxon rank-sum test. ns p > 0.05, ∗p < 0.05, ∗∗p < 0.01, ∗∗∗p < 0.001. |
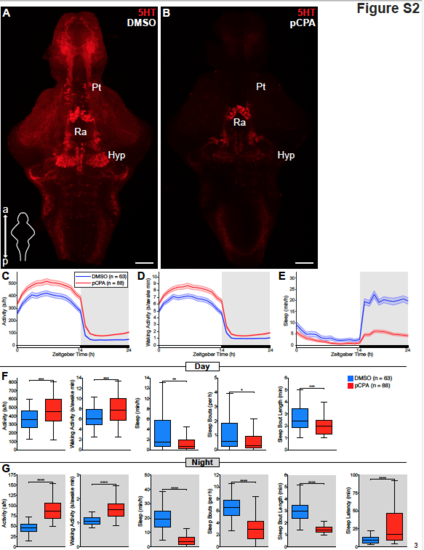
pCPA treatment depletes brain 5-HT and decreases sleep in zebrafish, related to Figure 1. (A and B) Maximum intensity projections of dissected brains from 5 dpf zebrafish treated with either DMSO vehicle (A) or pCPA (B) and immunostained for 5-HT. Scale bar, 50 μm; a, anterior; p, posterior; Ra, raphe; Hyp, hypothalamus; Pt, pretectal area. (C-E) Activity (C), waking activity (D), and sleep (E) for zebrafish treated with DMSO vehicle (blue) or 7.5 μM pCPA (red). Line and shading represent mean ± s.e.m. n = number of animals. (F and G) Boxplots quantifying activity, waking activity, sleep, sleep bout number, sleep bout length during day (F) and night (G) and sleep latency during night (G). n = number of animals. ns p>0.05, *p<0.05, **p<0.01, ***p< 0.001, ****p<0.0001, Mann-Whitney test |
|
ZFIN is incorporating published figure images and captions as part of an ongoing project. Figures from some publications have not yet been curated, or are not available for display because of copyright restrictions. |
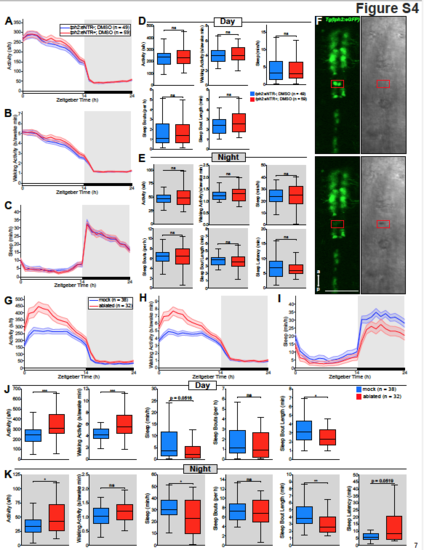
Vehicle treatment of Tg(tph2:eNTR-YFP) animals does not affect behavior; 2-photon laser ablation of the raphe results in increased locomotor activity and decreased sleep in zebrafish, related to Figure 3. (A-C) Activity (A), waking activity (B), and sleep (C) for Tg(tph2:eNTR-YFP) (red) and non-transgenic sibling control (blue) zebrafish treated with DMSO. Line and shading represent mean ± s.e.m. (D and E) Boxplots quantifying activity, waking activity, sleep, sleep bout number, sleep bout length during day (D) and night (E) and sleep latency during night (E). (F) Top: Image of Tg(tph2:eGFP) fish (green channel on left, transmitted light image on right) before ablation of cells in red box. Bottom: Same as above but after 2-photon laser ablation; note small cavitation in transmitted light image (red box). The same process was repeated until all GFP+ cells in the shown area were ablated. Scale bar, 50 μm; a, anterior; p, posterior. (G-I) Activity (G), waking activity (H), and sleep (I) for raphe laser-ablated (red) and mock laser-ablated sibling . control (blue) zebrafish. Line and shading represent mean ± s.e.m. (J and K) Boxplots quantifying activity, waking activity, sleep, sleep bout number, sleep bout length during day (J) and night (K) and sleep latency during night (K). n = number of animals. ns p>0.05, *p<0.05, **p<0.01, ***p<0.001, Mann-Whitney test |
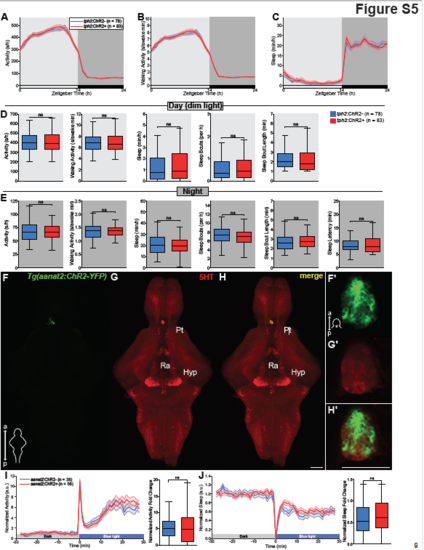
Tg(tph2:ChR2-YFP) zebrafish show normal wake/sleep cycles when maintained in dim light/dark cycles; blue light exposure does not affect behavior in zebrafish that express ChR2 in the pineal gland, related to Figure 4. (A-C) Activity (A), waking activity (B), and sleep (C) for Tg(tph2:ChR2-eGFP) (red) and non-transgenic siblingcontrol (blue) zebrafish maintained in a dim light/dark cycle. Line and shading represent mean ± s.e.m. n = number of animals. (D and E) Boxplots quantifying activity, waking activity, sleep, sleep bout number, sleep bout length during day (D) and night (E) and sleep latency during night (E). n = number of animals. ns p>0.05, Mann-Whitney test. (F-H’) Maximum intensity projections of dissected brains from 5 dpf Tg(aanat2:ChR2-YFP) zebrafish immunostained for 5-HT and YFP. a, anterior; p, posterior; Pt, pretectal area; Hyp, hypothalamus; Ra, raphe. The 5-HT+ structure above the Pt is the remnants of the pineal gland that was damaged during dissection. (F’- H’) Single plane images of the pineal gland from 5 dpf Tg(aanat2:ChR2-YFP) whole zebrafish immunostained for 5-HT and YFP. Scale bars, 50 μm. (I, J) Left: Normalized locomotor activity (I) and sleep (J) traces of 5 dpf Tg(aanat2:ChR2) zebrafish (red) and non-transgenic siblings (blue) before and during exposure to blue light. Right: boxplots quantifying normalized locomotor activity (I) and sleep (J) fold change during illumination. Line and shading represent mean ± s.e.m. n = number of animals; 3 trials per animal. ns p>0.05, Mann-Whitney test. |