
- Title
-
Single cell dynamics of embryonic muscle progenitor cells in zebrafish
- Authors
- Sharma, P., Ruel, T.D., Kocha, K.M., Liao, S., Huang, P.
- Source
- Full text @ Development
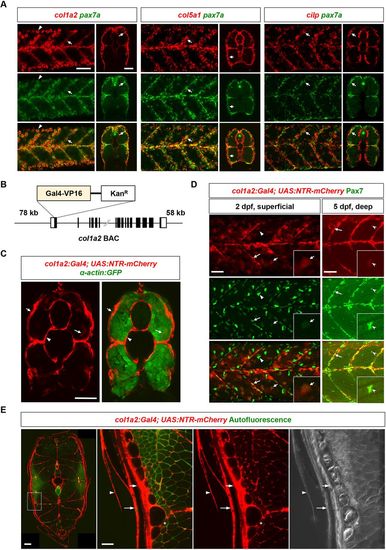
The dermomyotome is marked by the expression of ECM genes. (A) Double fluorescent in situhybridization shows the co-expression of ECM genes col1a2, col5a1 and cilp (red) with the MPC marker pax7a (green) in the dermomyotome (arrows) at 3 dpf. Both lateral and transverse views are shown. Note that the high level of col1a2 expression in the epidermis bleeds into the green channel (arrowheads). n=13 embryos per staining. (B) Schematics of the col1a2:Gal4 BAC reporter. (C) col1a2NTR-mCherry; α-actin:GFP fish at 3 dpf shows mCherry expression (red) in the dermomyotome (short arrows) on the surface of muscles, labeled by α-actin:GFP (green), cells around the notochord (arrowheads) and occasionally myofibers (long arrows). n=16 embryos. (D) col1a2NTR-mCherry fish (red) were co-stained with the anti-Pax7 antibody (green). At 2 dpf, a superficial plane shows that most mCherry+ cells are co-labeled with Pax7 (n=20 embryos). Note that Pax7 also labels mCherry− xanthophores (bean-shaped nuclei with stronger Pax7 staining, arrowheads). At 5 dpf, a deeper plane shows that some Pax7+ fiber-associated MPCs are weakly mCherry+ (n=37 embryos). Insets show magnified views of double positive MPCs. Long arrows: MPCs along the vertical myoseptum; short arrows: centrally located MPCs; notched arrowheads: fiber-associated MPCs. (E) Stitched confocal tile scans show transverse views of col1a2NTR-mCherry fish at 22 mm SL. Expanded views of the boxed region are shown on the right. mCherry expression (red) can be observed in the presumptive dermomyotome (short arrows), the skin (long arrows), scales (arrowheads) and occasionally muscles (asterisks). The autofluorescence signal (green) is shown to highlight the outline of myofibers. n=6 fish. Scale bars: 50 µm (A,C,D,E) and 200 µm (left panel in E). |
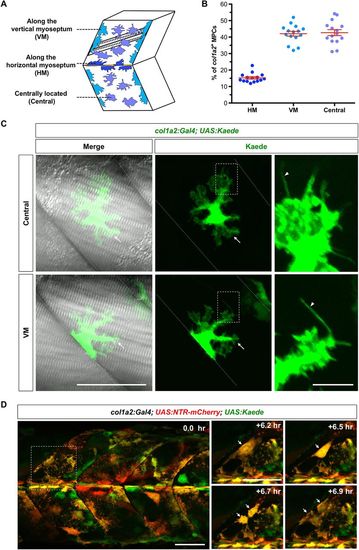
Characterization of col1a2+ MPCs. (A) Schematics of col1a2+ MPC distribution. (B) Quantification of col1a2+ MPC distribution at 2 dpf. n=15 embryos. (C) Mosaic col1a2Kaede embryos were selected to image single col1a2+ MPCs. Examples of centrally located MPCs (top panel) and MPCs along the VM (bottom panel) are shown. col1a2+ MPCs display ramified morphology with lamellipodia-like structures (arrows) and fine filopodia-like protrusions (arrowheads in expanded views). (D) col1a2:Gal4; UAS:NTR-mCherry; UAS:Kaede embryos were imaged at 2 dpf for 7.9 h. Stills from Movie 2 show the division of a col1a2+ MPC (arrows). Scale bars: 50 µm (C,D) and 20 µm (expanded views in D). |
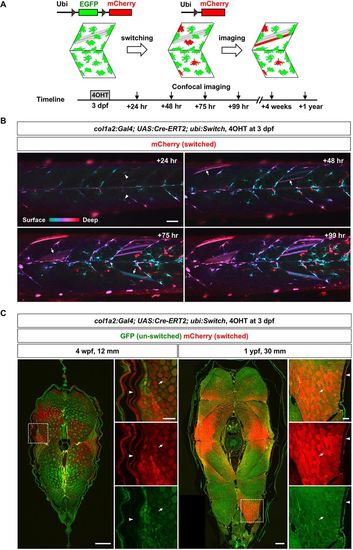
col1a2+ cells contribute to muscle growth. (A) Schematics of Cre-mediated lineage tracing experiments. (B) col1a2Cre-ERT2; ubi:Switch embryos were pulsed with 4-OHT for 2 h at 3 dpf to induce EGFP excision, and imaged for 4 days. Color-coded depth projections of mCherry expression are shown. ‘Switched’ mCherry+ MPCs (arrowheads) at the +24 h time point generated new mCherry+ myofibers (arrows) starting from the +48 h time point. n=20 embryos. (C) ‘Switched’ col1a2Cre-ERT2; ubi:Switch fish were sectioned and imaged at 4 wpf (n=4 fish at 12 mm SL) and 1 ypf (n=4 fish at 30 mm SL). Transverse sections (stitched confocal tile scans) with expanded views of boxed regions are shown. Arrows denote mCherry+ myofibers and arrowheads indicate the mCherry+ skin. Scale bars: 50 µm (B,C) and 200 µm (full views in C). |
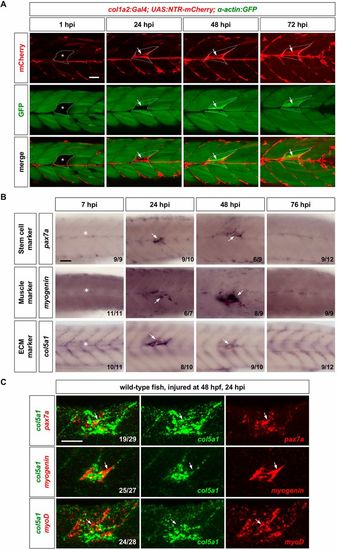
ECM dynamics during muscle regeneration. (A) col1a2NTR-mCherry; α-actin:GFP embryos were needle injured at 3 dpf, and imaged at 1, 24, 48 and 72 hpi. Injured muscles (asterisks) can be identified by the lack of α-actin:GFP expression (green) at 1 hpi, whereas regenerated muscles are marked by slightly elevated α-actin:GFP expression. mCherry+ cells (arrows) emerged at the site of injury at 24 hpi, and generated new mCherry+ myofibers by 72 hpi. Dotted lines outline the injured/regenerated regions. n=17 embryos. (B) Wild-type embryos were needle stabbed to injure muscles near the end of yolk extension (asterisks) at 3 dpf and stained for several markers (pax7a, myogenin and col5a1) at different time points. (C) Muscles of wild-type embryos were injured by needle stabbing at 48 hpf and double stained at 24 hpi using the col5a1 probe (green) with either pax7a, myogenin or myoD probes (red, arrows). Representative images are shown with the n number indicated for each staining in B and C. Scale bars: 50 µm. |
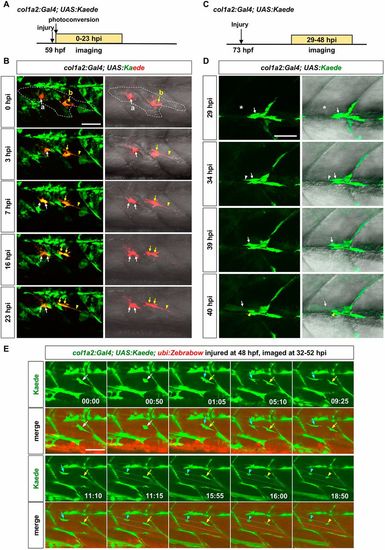
In vivo dynamics of col1a2+ MPCs during muscle regeneration. (A) Experimental design. col1a2Kaede embryos were needle injured, photoconverted at 59 hpf, and imaged at 0-23 hpi. (B) Still images from Movie 3 show the dynamics of 2 Kaedered cells. Both cells were within the muscle injury area (outlined by dashed lines). Cell labeled ‘a’ (white arrows) maintained the ramified morphology, and divided once at 7 hpi generating two daughter cells with similar morphologies. By contrast, cell ‘b’ (yellow arrows) extended to form an elongated morphology (arrowheads), and divided once at 16 hpi generating two polarized daughter cells. n=6 embryos. (C) Experimental design. Mosaic col1a2Kaede embryos were injured at 73 hpf, and imaged at 29-48 hpi. (D) Stills from Movie 4 show that a Kaede+ MPC (arrows) near the injury site (asterisks) elongated at 34 hpi (white arrowheads), formed protrusions at 39 hpi, and fused with a neighboring myofiber at 40 hpi. The new myofiber can be visualized by the weak Kaede expression throughout the muscle cytoplasm and the strong Kaede signal in the nucleus (yellow arrowheads). n=13 fusion events from 9 embryos. (E) col1a2Kaede; ubi:Zebrabow embryos were injured at 48 hpf and imaged at 32-52 hpi. Stills from Movie 6 are shown with time stamps (hh:mm) indicated. A Kaede+ MPC (white arrows) divided between 00:50 and 01:05. The anterior daughter (cyan arrows) fused with a myofiber (dotted lines) between 11:10 and 11:15, while the posterior daughter (yellow arrows) fused with the same myofiber between 15:55 and 16:00. Concentrated Kaede expression in the nucleus after the cell fusion was clearly visible (arrowheads of corresponding colors). n=31 fusion events from 12 embryos, of which 3 pairs of sibling cells sequentially fused with the same myofiber, as shown in E. Scale bars: 50 µm. |
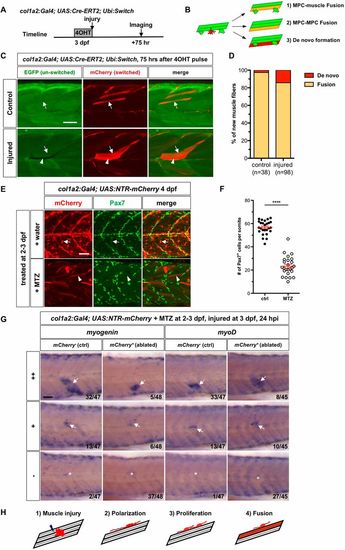
col1a2+ MPCs generate new myofibers primarily by cell fusion. (A) Experimental design. col1a2Cre-ERT2; ubi:Switch embryos treated with 4-OHT for 3.5 h at 3 dpf were either needle injured or left uninjured (controls) and imaged 75 h later. (B) Three possible modes of new myofiber formation. (C) In controls (n=20), new myofibers were formed primarily through cell fusion (arrows), whereas in injured embryos (n=19), new fibers were generated by both fusion (arrows) and occasionally, de novo fiber formation (arrowheads). (D) Quantification of modes of new myofiber formation. The number of new myofibers scored is shown. (E) col1a2NTR-mCherryembryos treated with either water or MTZ at 2-3 dpf were stained with the mCherry (red) and the Pax7 (green) antibodies at 4 dpf. Water-treated controls showed many mCherry+Pax7+ MPCs (arrows), whereas MTZ-treated embryos lost most mCherry+ MPCs with a few spared myofibers (arrowheads). (F) Quantification of the average number of Pax7+ MPCs per somite, including superficial MPCs and deep myofiber-associated MPCs shown in E. n=26 (control) and 25 (MTZ). Data are plotted as mean±s.e.m. Statistics: Mann–Whitney U-test. ****P<0.0001. (G) col1a2NTR-mCherry embryos (ablated) or mCherry− siblings (control) were treated with MTZ at 2-3 dpf, injured at 3 dpf and stained for myogenin or myoD expression at 24 hpi. Embryos were scored based on the extent of expression of myogenic markers at the injury site: high level (++), mid-level (+) and no induction (−). The number of embryos in each category is indicated. Arrows denote induced marker expression and asterisks indicate the injury site in the case of no induction. (H) Model of muscle regeneration by col1a2+ MPCs. Scale bars: 50 µm. PHENOTYPE:
|
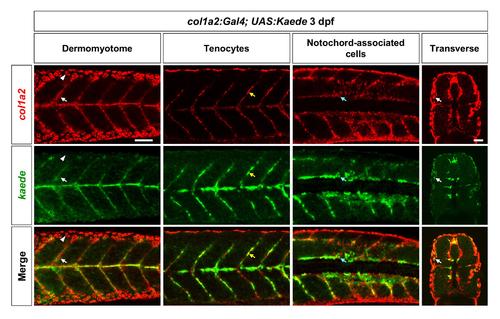
Validation of the col1a2Kaede line. Double fluorescent in situ hybridization using kaede and col1a2 probes were performed in col1a2Kaede embryos at 3 dpf. Co-expression of kaede (green) and the endogenous col1a2 (red) can be observed in dermomyotome cells (white arrows), tenocytes along the vertical myoseptum (yellow arrows), and deep interstitial cells around the notochord (cyan arrows). Note that col1a2Kaede was not expressed in the epidermis (arrowheads) as col1a2. n = 19 embryos. Scale bar: 50 μm. |
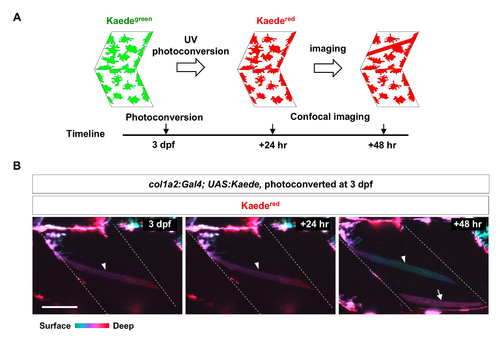
col1a2+ cells contribute to muscle growth. (A) Schematics of photoconversionbased lineage tracing. (B) col1a2Kaede embryos were photoconverted at 3 dpf, and imaged at indicated time points. Color coded depth projections (green corresponds to superficial slices, while red denotes deep slices) of converted Kaedered showed that new Kaedered muscle fibers (arrow) emerged at 48-hour post conversion. An existing muscle fiber present through all 3 time points is indicated by arrowheads. n = 15 embryos. Scale bar: 50 μm. |
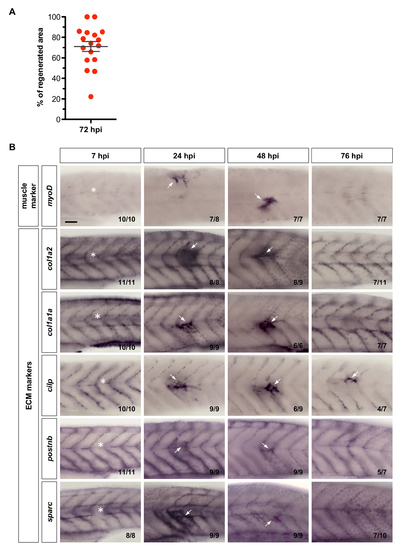
ECM molecules are upregulated during muscle regeneration. (A) Quantification of col1a2+ MPC contribution to muscle regeneration in col1a2NTR-mCherry; α- actin:GFP embryos at 72 hpi. The corresponding experiment is shown in Figure 4A. The percentage of contribution was calculated by dividing the area of mCherry+ muscle fibers at the injury site by the total regenerated area marked by slightly elevated α-actin:GFP expression. Data are plotted with mean ± SEM indicated. n = 17 embryos. (B) Wild-type embryos were needle stabbed to injure a somite near the end of yolk extension (asterisks) at 3dpf, and fixed at 7, 24, 48, and 76 hpi. Embryos were then stained with the myogenic marker (myoD) and ECM markers (col1a2, col1a1a, cilp, postnb, and sparc). All markers showed upregulation at the site of injury starting from 24 hpi (arrows). Representative images are shown with the n number indicated for each staining. Scale bar: 50 μm. |
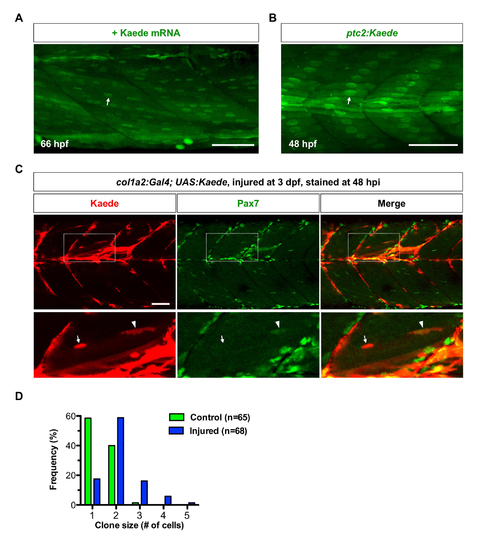
Kaede protein is preferentially localized in nuclei of muscle fibers. (A) Wildtype embryos were injected with Kaede mRNA, and imaged at 66 hpf. Kaede protein (green) is preferentially localized in the nuclei of muscle fibers (arrow). n = 40 embryos. (B) Kaede protein (green) is concentrated in the nuclei of slow myofibers (arrow) in ptc2:Kaede embryos at 48 hpf. n = 40 embryos. (C) col1a2Kaede embryos were injured at 3 dpf, and stained at 48 hpi Supplementary information with the anti-Pax7 antibody (green). Kaede+ cells (red) contributed to muscle regeneration (boxed regions). The expanded views show that newly formed muscle fiber displayed strong Kaede expression in the nucleus (arrows), which was not labelled by Pax7. By contrast, a small elongated Kaede+ cell between muscle fibers was Pax7 positive (arrowheads). n = 11 embryos. (D) Quantification of clone size in single cell clonal analysis described in Fig 5. col1a2+ MPCs under the injury condition (blue, n=68) tend to generate larger clones compared to MPCs in the wild-type condition (green, n=65). Scale bars: 50 μm. |
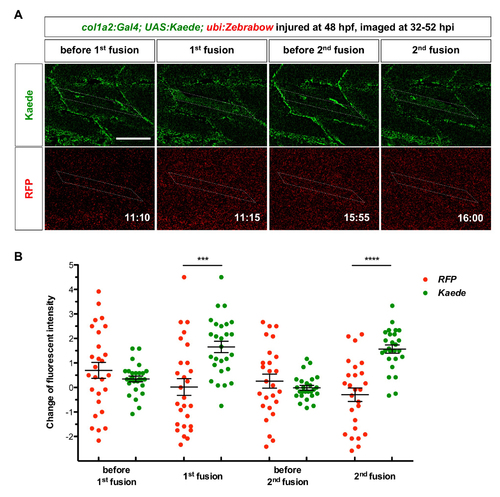
Quantification of sequential muscle fusion of col1a2+ sibling cells. col1a2Kaede; ubi:Zebrabow embryos were injured at 48 hpf, and imaged from 32 to 52 hpi. The same experiment is also shown in Figure 6E and Movie 6. (A) Image quantification. Change in fluorescent intensity at each time point was generated by subtracting the fluorescent intensity of corresponding channels at the previous time point (5 minutes earlier). Note that negative pixel values after image processing were set to zero. The muscle fiber that col1a2+ sibling cells fused to is indicated by dotted lines. The increase of Kaede intensity but not the RFP signal in the muscle fiber can be observed at 11:15 (1st fusion event) and 16:00 (2nd fusion event). (B) Quantification of fluorescence change before and after cell fusions. Small ROIs within the outlined muscle fiber were measured for fluorescent intensity at different time points (n = 27 for the 1st fusion event and n = 26 for the 2nd fusion event). Change in fluorescent intensity for each ROI in each channel was calculated and plotted for each time point. For example, change in fluorescent intensity for a given ROI at the 1st fusion (11:15) was generated by subtracting the fluorescent intensity at 11:10 from the intensity at 11:15. Significant increase in Kaede intensity but not the RFP signal in the muscle fiber can be observed at 11:15 (1st fusion event) and 16:00 (2nd fusion event), suggesting fusion events between a Kaede+ MPC and a muscle fiber. All data are plotted with mean ± SEM indicated. Statistics: Mann-Whitney U test. Asterisks representation: p-value < 0.001 (***) and p-value < 0.0001 (****). Scale bar: 50 μm. |