
- Title
-
Glia Accumulate Evidence that Actions Are Futile and Suppress Unsuccessful Behavior
- Authors
- Mu, Y., Bennett, D.V., Rubinov, M., Narayan, S., Yang, C.T., Tanimoto, M., Mensh, B.D., Looger, L.L., Ahrens, M.B.
- Source
- Full text @ Cell
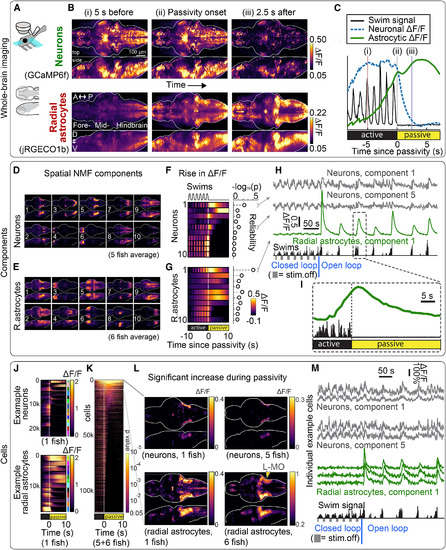
Whole-Brain Neuronal and Astrocyte Dynamics Show Ca2+Increases in Specific Cell Populations during Futility-Induced Passivity (A) Experimental setup. A light-sheet microscope recorded from most radial astrocytes and neurons in the brain at cellular resolution, using either single-population GCaMP6f or simultaneous dual-color GCaMP6f and jRGECO1b recordings, while fictive behavior was monitored and visual stimulus was delivered. (B) Whole-brain neuronal and glial activity before, at, and after passivity onset in an example Tg(gfap:jRGECO1b); Tg(elavl3:GCaMP6f)fish. Top: mean neuronal brain-wide activity was higher during active behavior than passivity. Bottom: conversely, mean brain-wide glial Ca2+signals increased before passivity onset and remained elevated during passivity. A, anterior; P, posterior; D, dorsal; V, ventral. Images are maximum-intensity projections of means triggered on passivity onset (64 events). (C) Neuronal and glial signals near passivity onset, averaged across the brain of the same fish from (B). Average neuronal Ca2+ decayed after passivity onset, while average glial Ca2+ increased before passivity onset and peaked soon after. (D and E) Spatial NMF components. Neuronal and glial data recorded with GCaMP6f in separate transgenic lines. Brightness: spatial NMF weights. n = 5 fish (neurons), n = 6 fish (radial astrocytes). (F and G) Temporal neuronal and glial Ca2+ signals, per NMF component of (D) and (E), averaged over fish and trials, centered on passivity onset. Right: reliability (–log10(p)), calculated by comparing Ca2+ activity 1–4 s after passivity onset to mean activity 10–5 s before passivity onset (higher reliability: more consistent responses over trials). Multiple neuronal and glial components had strong correlations to behavior. Neuronal and glial component 1 overlaps with L-MO. (H) Signals from example fish; see also Figure S2B. Fish was first in closed loop, presented with alternating moving and stationary gratings (fish swam little during stationary gratings), and next in open loop, wherein animals cycled through active and passive states. Radial astrocytes were engaged in switches to passivity in open loop, not swim pauses in closed loop. (I) Astrocytic signal from (H), showing a rise before and peak after passivity onset. (J) Cellular signals from segmented neurons and glia from two example fish, grouped by component (colored bars, right), relative to passivity onset. (K) Neurons and glia (random subset) from all fish with elevated signals after passivity onset, ordered by p value from a statistical test of how reliably Ca2+ is increased above baseline (10–5 s before passivity). (L) Brain maps of neurons and radial astrocytes with reliably elevated Ca2+ just after passivity onset (1–4 s) relative to baseline. L-MO signals were most consistently above baseline across fish. Left: example. Right: population average (5 fish for neurons, 6 for glia, registered to standard brain). p values were not used to test statistical significance but to create an exploratory functional brain map (STAR Methods). (M) Ca2+ traces from single cells, same fish as in (H) and (I), during closed loop (left) and open loop (right). Radial astrocytes selectively respond to futility-induced passivity. |
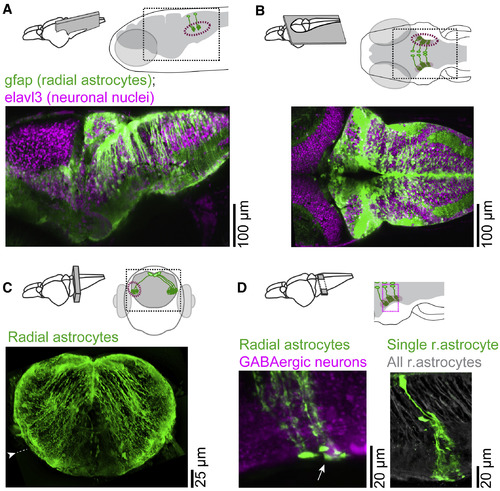
Morphology of Radial Astrocytes Projecting to L-MO (A) Maximum intensity projection (MIP) along the medial-lateral axis of a 20 μm section from Tg(elavl3:H2B-GCaMP6f);Tg(gfap:tdTomato) fish. Dashed line, L-MO location. Neurons, magenta; glia, green. (B) MIP along dorsal-ventral axis of a 20 μm section, same fish as (A). Radial astrocytes ramify in L-MO. (C) MIP along the rostral-caudal axis of a 20 μm section in hindbrain. Radial astrocyte processes project ventral-laterally. Scale bar is corrected for 4× expansion (Freifeld et al., 2017, Tillberg et al., 2016) to approximate in vivo dimensions. Arrowhead indicates microscopy software stitching artifact. (D) MIP along dorsal-ventral axis. Diagonal section with one (right) or several (left) radial astrocytes electroporated with synthetic dye. Astrocytic somata are proximal to dorsal midline of hindbrain; their processes run ventral-laterally, are dense in lateral hindbrain (green at brain border), and appose GABAergic somata (left: white arrow, magenta, labeled by Tg(gad1b:RFP)); radial astrocytes (right: gray) labeled by Tg(gfap:jRGECO1b). |
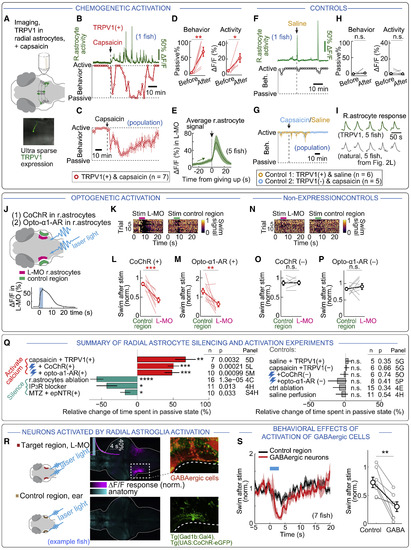
Activation of Radial Astrocytes Reduces Swimming (A) Experimental design. Rat TRPV1 was expressed in ∼1% of radial astrocytes in Tg(gfap:jRGECO1b) fish. Fish were exposed to the TRPV1 agonist capsaicin. (B) Example fish with increased Ca2+ transients in L-MO and concurrent increase in passivity after capsaicin treatment. The effect diminished after ∼1 h, maybe due to TRPV1 desensitization and internalization (Sanz-Salvador et al., 2012), showing that fish remain healthy, as they can swim normally. Dashed line (passive) means the fish is passive 100% of the time; dashed line (active) means it is passive 0% of the time (both measured in 2 min bins). (C) Population data, showing increased passivity after activation of TRPV1. n = 7 fish. (D) Population data of L-MO astrocytic Ca2+ increase and passivity with TRPV1 activation. Two-tailed paired t test, behavior: p = 0.0029, n = 7 fish. ΔF/F: p = 0.027, n = 5 fish. (E) Astrocytic Ca2+ in L-MO near passivity onset. Average signal increased just before passivity onset and peaked just after, as in futility-induced passivity (Figures 2G–2I). Shading, SEM. (F) Control, example. No reduction of swimming or increase in astrocytic Ca2+ when saline was added to fish expressing TRPV1. (G) Control, population data. No change in behavior when saline was added to fish expressing TRPV1 (n = 6 fish) or capsaicin to fish without TRPV1 (n = 5 fish). (H) Summary of controls. Experiments as in (F) and (G) were pooled. Two-tailed paired t test, behavior: p = 0.48, n = 11 fish. ΔF/F: p = 0.51, n = 7 fish. (I) Normalized mean L-MO glial Ca2+ signals centered on the onset of passivity, induced by TRPV1 in closed loop (top) or by motor futility in open loop (bottom). Surges appear similar. Ca2+ in TRPV1+ animals did not saturate. (J) Experimental design. Local optogenetic excitation of glial processes in fish expressing CoChR or Opto-α1-AR increases glial Ca2+ in L-MO (CoChR shown). (K) Optogenetic (CoChR) excitation of L-MO glia reduced swimming for ∼10 s. Blue light outside the brain caused a much milder and briefer reduction. (L and M) Population data show reduced swimming relative to controls in fish expressing CoChR (L) or Opto-α1-AR (M) in radial astrocytes. Two-tailed paired t test, CoChR, p = 0.00012, n = 9 fish; Opto-α1-AR, p = 0.0065, n = 10 fish. (N–P) Controls for (K)–(M) show no effect in fish without CoChR or Opto-α1-AR. Two-tailed paired t test, CoChR: p = 0.89, n = 6 fish. Opto-α1-AR, p = 0.50, n = 8 fish. (Q) Summary of Figures 4 and 5, showing significant increases in passivity after increases in astrocytic Ca2+, decreases after astrocytic silencing, and no effects in control experiments. Effects are normalized by maximal possible change (control passive % for decreases; control active % for increases) for each fish. (R) Optogenetic activation of L-MO radial astrocytes activates GABAergic neurons at edge of L-MO in Tg(gfap:CoChR-eGFP);Tg(elavl3:jRGECO1b) fish. Left: maximum-intensity projection of ΔF/F after optogenetic activation of radial astrocytes (magenta) and anatomy (cyan) in example fish. Inset: Ca2+ in GABAergic neurons after astrocytic activation; stimulation time in cyan. Top right: Tg(gad1b:RFP);Tg(elavl3:H2B-GCaMP6f) used to label GABAergic neurons; bottom right: Tg(gad1b:Gal4);Tg(UAS:CoChR-eGFP) to sparsely label GABAergic neurons. (S) Activation of GABAergic cells with laser light in Tg(Gad1b:Gal4);Tg(UAS:CoChR-eGFP) suppresses swimming. Two-tailed paired t test, p = 0.0074, n = 7 fish. |
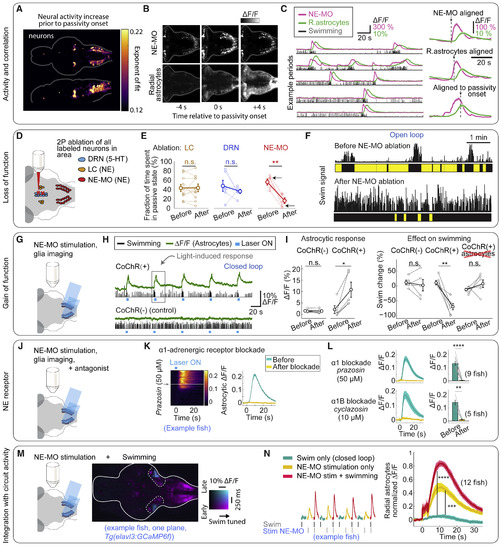
Noradrenergic System Activates Radial Astrocytes and Is Required for Futility-Induced Passivity (A) Rate of neuronal activity increase before passivity onset quantified by the exponent of an exponential fit to average Ca2+ signals before passivity (overlay of 5 fish, Tg(elavl3:GCaMP6f)). Population with the highest rate of increase overlaps with NE neurons (see Figure S6A). (B) Simultaneous imaging of NE neurons and radial astrocytes. Example Ca2+ signals just before, at, and after passivity onset. (C) Examples of NE-MO activity, glial Ca2+ increases, and swimming in an alternating closed- and open-loop protocol. Right: average Ca2+activity from NE-MO and radial astrocytes, aligned to NE-MO response onset, radial astrocyte response, or passivity onset. (D) Experimental design: single-cell 2-photon ablation of LC, NE-MO, or DRN in transgenic zebrafish labeling these nuclei. (E) Time in passivity was strongly reduced after NE-MO ablation, but not after ablation of LC or DRN. Two-tailed paired t test, p = 0.95, n = 10 fish for LC; p = 0.40, n = 6 fish for DRN; p = 0.0070, n = 5 fish for NE-MO. (F) Example shows NE-MO ablation reduced futility-induced passivity. Arrows in (E), corresponding data points. (G) Experimental design: optogenetic activation of NE-MO cells using DMD-targeted light delivery in fish expressing CoChR in NE cells while imaging radial astrocytes expressing jRGECO1b. (H) Example fish, NE-MO activation led to increased L-MO glial Ca2+, then passivity. Swimming increases briefly at light onset (see Figure S6D). (I) Population data: NE-MO activation increased L-MO glial Ca2+ (left) and reduced swimming (right) in CoChR+ fish. Two-tailed paired t test, CoChR+ imaging, p = 0.025, n = 5 fish; CoChR+ behavior, p = 0.0024, n = 6 fish; CoChR− imaging, p = 0.52, n = 7 fish; CoChR− behavior, p = 0.56, n = 5 fish; glial ablation, p = 0.27, n = 6 fish. (J) Experiment to identify receptors. Experiment as in (G) with NE receptor antagonists added to bath. (K) α1 NE receptor antagonist prazosin (50 μM) abolishes radial astrocyte response evoked by NE-MO stimulation. (L) Population data. α1 NE receptor antagonist prazosin (50 μM) or α1B antagonist cyclazosin (10 μM) abolished radial astrocyte responses. Two-tailed paired t test, prazosin, p = 4.6 × 10⁻⁵, n = 9 fish; cyclazosin, p = 0.0042, n = 5 fish. Shading, SEM. (M) Experimental design to test whether L-MO radial astrocytes integrate NE and local circuit activity. In closed loop, NE-MO cells are optogenetically stimulated during swimming (higher L-MO neuronal activity), or during not swimming. (N) Integration of NE and local circuit activity. Radial astrocytic Ca2+responses to NE during swimming are larger than to NE alone. Left: examples from successive trials. Right: summary of all fish. Two-tailed paired t test, p = 2.4 × 10⁻⁴ for NE-MO stimulation only versus swimming only, p = 2.4 × 10⁻⁸ for NE-MO stimulation + swimming versus swimming only, n = 12 fish. Shading, SEM. |
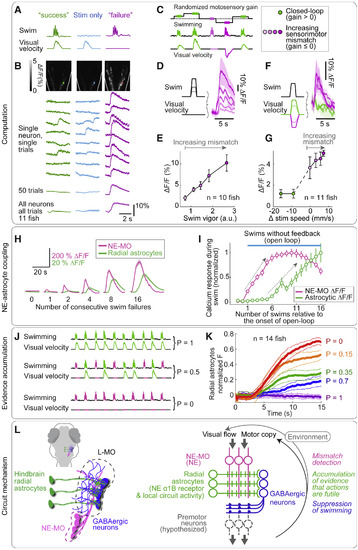
Noradrenergic System Signals Visuomotor Mismatch; Radial Astrocytes Accumulate Evidence that Actions Are Futile (A) Mismatch assay. Left: in closed loop, motor output triggers visual feedback (motosensory gain > 0). Middle: stimulus only with no swimming. Right: sensory-motor mismatch in swim failures (gain = 0). (B) Mismatch signals in NE-MO. In closed loop or visual signal alone, NE-MO responses were small. During swim failures, NE-MO responses were large. (See Figure S6H for LC, which does not respond to mismatch until next swim bout.) (C) Extended mismatch assay: motosensory gain randomly set for each swim bout, varying combinations of motor vigor and visual velocity. (D–G) NE-MO responses encode sensory-motor mismatch. (D and E) NE-MO responses grew with stronger motor vigor if no visual stimulus was shown. (D, example fish; E, population data, 10 fish.) (F and G) NE-MO responses were minimal in closed loop (motosensory gain > 0), whether gain was high or low. In open loop (no feedback, gain = 0) NE-MO responded. With opposite feedback (forward visual feedback during swimming, high mismatch, motosensory gain < 0), NE-MO response was larger. In (F and G), average motor vigor is similar across visual speeds due to randomization of gain. (F, example fish; G, population data, 11 fish). Shading, SEM. (H) Radial astrocyte Ca2+ integrates swim failures. Fish swam in closed loop, then open loop for 1, 2, 4, 8, or 16 swim bouts, then back to closed loop. Glial signals increased with number of failed bouts after ∼2 failed bouts; NE-MO signals began increasing with first failed bout. Trials with passivity not included. NE-MO signal sometimes saturated or decreased while glial Ca2+ continued to increase. (I) Radial astrocyte Ca2+ accumulated with increasing numbers of swim failures. NE-MO Ca2+ also increased initially but saturated or decreased, while glial Ca2+ continued to increase with swim failures until feedback returns to closed loop. Gray arrows, accumulation. (J) Experiment: information accumulation in radial astrocytes. In a swim bout, probability that fish sees visual feedback (backward visual flow) is P. P = 1, closed loop; P = 0, open loop; intermediate P gives probabilistic feedback. (K) Information accumulation in radial astrocytes. Ca2+ signal, averaged over fish and trials, reflects P, the probability that a swim bout gives visual feedback, so glia accumulate information on swim futility over time (n = 14 fish). (L) Circuit diagram. NE-MO represents mismatch signal, computed from visual and motor efference input. Noradrenergic axons from NE-MO excite glial processes in L-MO through α1B NE receptors (see Figure S6C for projections). Radial astrocytes integrate mismatch signals and suppress swimming via downstream GABAergic neurons. |
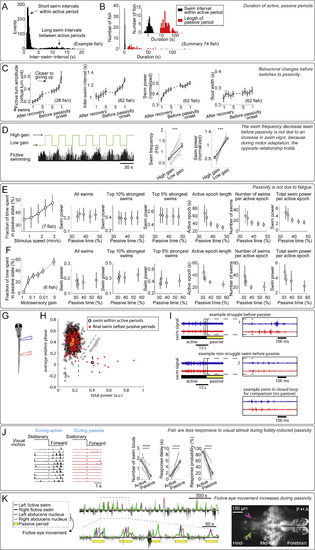
Higher-Order Behavioral Effects of Futility-Induced Passivity, Related to Figure 1 (A and B) Distribution of inter-swim intervals in open-loop. Intervals followed a bimodal distribution: short swim intervals occurred within the active period when fish swam once every 1-2 s, and long swim intervals occurred between active periods when the fish stopped swimming (defined as the ‘passive period’). (A) Distribution of all inter-swim-intervals from an example fish. (B) Distribution of average inter-swim-intervals during classified active periods (black bars), and average duration of passive periods (red bars) across fish. (C) Over the course of an active period in open-loop, the animals: 1. made larger turns, and turning amplitude was largest just before passivity onset; 2. swam less frequently, and the longest interval between swims happened just before passivity onset; 3. swam more vigorously, and swimming was on average strongest just before passivity onset; 4. but the duration (width) of swim bouts was not strongly modulated. Error bars, SEM. (D) Decrease in swim frequency (seen before passivity in C) is not due to an increase in swim power, control for Figure 1I. (Left) Motor adaptation assay; low motosensory gain in a closed-loop environment led to more powerful swimming. (Right) During low motosensory gain, swim frequency and swim power were both elevated compared to during high motosensory gain. Therefore, the decrease in swim frequency observed as the animal approaches passivity (Figure 1I) was not simply due to a concurrent increase in swim power. (Two-tailed paired t test, ∗∗∗p < 0.001, p = 8.9 × 10⁻⁶ for swim frequency, p = 2.7 × 10⁻⁶ for normalized swim power. Error bars, SEM) (E and F) Effects of stimulus velocity and motosensory gain on futility-induced passivity imply that passivity was unlikely to be caused by fatigue. More passivity was caused by (E) faster forward-moving visual stimulus in open loop, or (F) lower motosensory gain in closed loop. Under those conditions, increased occurrence of passivity was not due to more vigorous or more frequent swimming because: similar swim power of individual swims was observed for different velocities or gains, as well as of the top 10% strongest swims and the top 5% strongest swims. On the contrary, more passivity can be associated with smaller amounts of total swim output: shorter active periods, fewer swim attempts, and less total swim power. Together, these results imply that passivity was not caused by fatigue. Error bars, SEM. (G–I) During transitions from active periods to passive periods, fish occasionally struggle. (G) Experimental setup showing placement of an electrode pair, recording electrical signals from the same side but different segments of the tail (Liao and Fetcho, 2008). (H) Struggles can be identified by the relative phase difference between anterior and posterior electrodes, and power per burst. Final swims before passivity can be non-struggle swims or struggles. On average 13 ± 9% of switches are preceded by a struggle (identified by burst power, n = 5 fish, mean ± SEM). (I) Example of switches preceded by a struggle (top), non-struggle swim (middle), and for comparison, closed-loop swimming (bottom). (J) Fish were less responsive to visual stimuli during the passive periods. In an assay where, first, passivity was elicited by the usual paradigm, then a static stimulus was presented (2 s), and then pulse of visual motion was presented (2 s), the animals responded far less to the motion pulse if they were in the passive behavioral state. (Two-tailed paired t test, ∗∗∗∗p < 0.0001, p = 2.6 × 10⁻⁶ for swim bout number change, p = 3.8 × 10⁻⁵ for response delay, p = 4.2 × 10⁻⁷ for response probability. Error bars, SEM) Same data as in Figure 1K. (K) During the passive periods, calcium activity was seen in neurons in the abducens nucleus (arrows) in animals expressing nuclear-localized GCaMP6f (Tg(elavl3:H2B-GCaMP6f)) imaged with a light-sheet microscope. Neurons in the abducens nucleus are known to drive eye movement. Thus, increased activity in this area, alternating between left and right, implies that animals were attempting to move their eyes during the passive periods. |
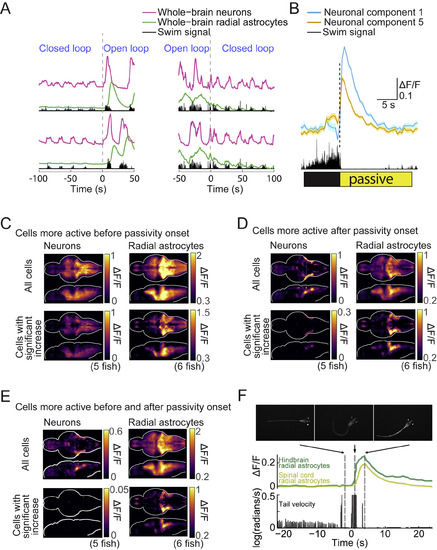
Whole-Brain Activity Elevation before and after Passivity Onset in Both Paralyzed and Non-paralyzed Fish and Passivity in Non-paralyzed Fish, Related to Figure 2 (A) Neuronal and astrocytic activity near the time of open-loop onset (left), and closed-loop onset (right). Signals are averaged across all the neurons or all the radial astrocytes in the brain, and two switches from each type are shown (top and bottom). Neurons showed stronger activity fluctuations during open-loop than during closed-loop, but showed clear activity patterns in both scenarios. In contrast, astrocytic activity fluctuations (calcium) were small before open-loop, but increased before and during passivity. Signals are z-scored. (B) Average activity of neuronal component 1 and component 5, from the same fish in Figure 2H, triggered by passivity onset. Each trace is the average of 42 switches from active to passive states. Shading represents SEM. (C–E) Whole-brain neuronal and astrocytic maps for cells showing activity elevation in windows before, after, or both before and after passivity onset (average over 5 fish for neuronal imaging, 6 for astrocytic imaging). Average ΔF/F signals from cells statistically increasing their activity relative to baseline (Methods), (C) before passivity onset (−1 to 0 s). (D) after passivity onset (+1 to 4 s). (E) both before and after passivity onset (−1 to 0 s and +1 to 4 s). For each panel, top rows show average activity from all cells, and bottom rows show average activity only from cells with significant activity elevation. (F) A zebrafish, expressing GCaMP6f in radial astrocytes, was placed in agarose. The agarose was slowly coagulating, but never fully prevented tail motion. The fish attempted to swim and the viscous agarose prevented the movement, qualitatively mimicking a reduction in motosensory gain. The animals displayed similar passivity as in the virtual reality assay. Calcium levels followed a similar pattern as was seen in futility-induced passivity in virtual reality. Calcium activity also increased in the spinal cord, but with a delay. |
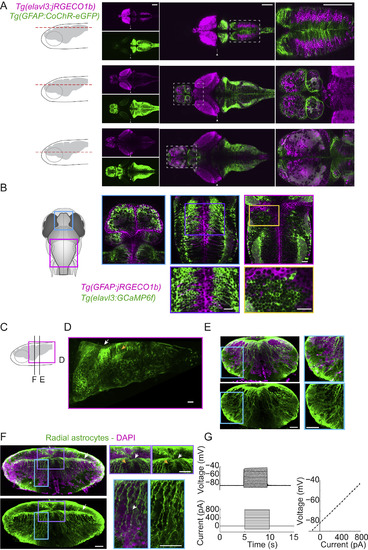
Anatomical and Electrophysiological Properties of Radial Astrocytes Projecting to the L-MO, Related to Figure 3 (A) Distinct expression patterns of CoChR-eGFP driven by the gfappromoter and jRGECO1b driven by the elavl3 promoter suggests that the gfap-driven expression was largely restricted to radial astrocytes. Three columns represent three sections arranged from dorsal to ventral across the brain, indicated by the horizontal dashed lines in the schematic at the top of each column. Row 1, separated channels for CoChR-eGFP and jRGECO1b (the green channel was overexposed in order to visualize the low-level fluorescence in the tectum); Row 2, merged view of those two channels; Row 3, zoomed-in view of the region outlined by dashed lines in Row 2. Arrowheads indicate microscopy software stitching artifacts. Scale bars, 100 μm. (B) Distinct expression patterns of jRGECO1b driven by the gfappromoter and GCaMP6f driven by the elavl3 promoter, the combination being used for simultaneous imaging of radial astrocytes and neurons. Scale bars, 20 μm. (C) Schematic side view of the fish brain showing the position of the panel (D) and the cross sections in (E) and (F). (D) Side view of a section of the hindbrain showing astrocytic cell bodies and processes (white arrow) and the lateral hindbrain neuropil (yellow arrow). Scale bars, 100 μm. (E) Cross section from a level of the hindbrain that contains the lateral hindbrain (L-MO) (the cyan box inset contains the L-MO). Scale bars, 100 μm. (F) Cross section at the level of the cerebellum showing the midbrain-hindbrain border (MHB) (arrow). Top-Left, Astrocytic cells are shown in green; DAPI staining labels nuclei of all cells (neurons and radial astrocytes). Bottom-Left, astrocytic cells only. Purple box inset, astrocytic cell bodies (white arrow) can be seen along the dorsal midline and the MHB. Neurons are dark without the GFAP label (yellow arrow). Cyan box inset, long astrocytic processes extend dorso-ventrally and terminate in the lateral and ventral gliopil. Scale bars, 100 μm. (G) Patch-clamp recording of a GCaMP6f-positive cell from a Tg(gfap:GCaMP6f) fish shows electrophysiological properties of radial astrocytes: (1) a linear voltage change in response to injected current, (2) more negative resting membrane potential than typical neuronal membrane (−84 mV), consistent with known recordings of radial astrocytes in zebrafish (Li et al., 2015). Error bars, SEM. |
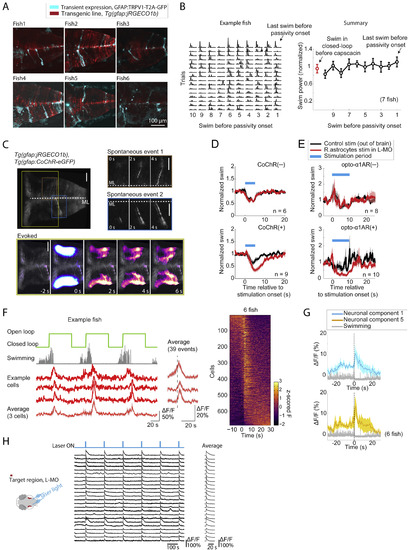
Details of Chemogenetic and Optogenetic Activation of Radial Astrocytes, Related to Figure 5 (A) Sparseness of expression of TRPV1. Maximum intensity projections along the dorsal-ventral axis of hindbrain volumes acquired with a light sheet microscope show that TRPV1 (Chen et al., 2016) channels (introduced into the fish by injection of a gfap:TRPV1-T2A-GFP, plasmid into Tg(gfap:jRGECO1b) transgenic embryos) were sparsely expressed in radial astrocytes. Expression was seen in about 10-50 astrocytic cells per animal, but opening of the TRPV1 channel with capsaicin activated a much wider population of glial cells (at least hundreds, likely through communication between radial astrocytes). Expressing cells showed the morphology of hindbrain radial astrocytes, with somata along the midline and processes extending laterally and then ramifying. (Note, the images show some contamination from skin autofluorescence. Also note, the jRGECO1b expression was more patchy than usual, likely because the co-injected Tol2 transposase removed the jRGECO1b transgene from the genome of some cells.) (B) Artificially activating radial astrocytes induces passivity without increasing swim vigor, consistent with a role for radial astrocytes in specifically suppressing swimming. Passivity was caused in closed-loop by applying capsaicin to fish that expressed TRPV1 (Chen et al., 2016) in radial astrocytes. In the swim bouts just prior to TRPV1-mediated passivity, swim vigor did not increase as it did during futility-induced passivity (Figure S1C) – rather, swim vigor stayed at a similar level as swims in closed-loop without capsaicin, showing that radial astrocytes caused passivity independently of increases in swim vigor. In example fish (left panel), each row represents the final 10 swims of an active period before the fish switched to a passive state. Error bars, SEM. (C) Optogenetic stimulation during functional imaging of radial astrocytes shows that exciting these cells can cause spatially propagating calcium activity. Top row: after optogenetic excitation of astrocytic processes in the L-MO, a wave of calcium can be seen propagating from the site of excitation to the astrocytic cell bodies located along the midline. The time course of evoked activity resembles spontaneous activity of single astrocytic cells (top right), which suggests that optogenetic stimulation is sufficient to drive an endogenous calcium-dependent excitatory pathway in radial astrocytes. Scale bars, 20 μm. (D and E) Optogenetic stimulation of L-MO astrocytic processes suppresses swimming. (D) Top: CoChR-negative controls showed no difference in behavior when the L-MO was stimulated or light was targeted outside of the brain (targeted to the ear, chosen because it is very close to the L-MO but outside the brain). A small response to the blue light was present if either the L-MO or the ear was targeted. Bottom: The same experiment in animals expressing CoChR in radial astrocytes showed a difference in behavior, with L-MO stimulation leading to a prolonged suppression of swimming. In total 30 pulses with a width of 10 ms and inter-pulse-interval of 90 ms were delivered for each stimulation (Methods). Shading represents SEM (E) Stimulation in Opto-α1-AR expressing animals similarly showed a suppression of swimming. A continuous 10 s of light stimulation was delivered for each stimulation (Methods). Shading represents SEM. (F) GABAergic neurons in L-MO activated during switches to passivity. Left, fish switching to the passive state after entering open-loop, with activity increases in GABAergic neurons in L-MO at the time of switches. Right, summary of all GABAergic neurons in L-MO from 6 fish. Cells are ordered by the center of mass along the time axis. Shading represents SEM. (G) Capsaicin activation of astrocytic calcium causes an increase in neuronal activity in L-MO neurons, consistent with the activation of GABAergic neurons in L-MO after astrocytic stimulation (Figure 5R). Shading represent SEM. (H) Optogenetically stimulating radial astrocytes causes increases in neuronal activity in L-MO neurons. Shading represents SEM. |
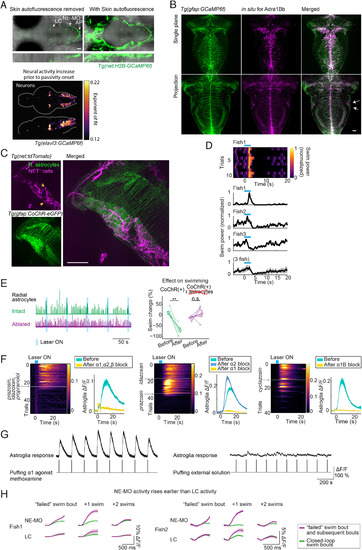
Calcium Signals in Noradrenergic Neurons Increase before Switches to Passivity, Noradrenergic Receptors Are Highly Expressed and Co-localized with Radial Astrocytes in the Lateral Hindbrain, Activation of Noradrenergic Neurons Can Elicit a Transient Increase in Motor Vigor, and Coding for Swim Failures in Different NE Nuclei, Related to Figures 6 and 7 (A) Top: The nuclei of noradrenergic (NE) neurons (Farrar et al., 2018) are labeled in Tg(net:H2B-GCaMP6f) fish. Bottom: The neurons which increase their activity fastest prior to passivity onset overlap with the regions where the somata of noradrenergic cells, including the locus coeruleus (LC) and the NE cluster of the medulla oblongata (NE-MO), are located. Imaged line in the bottom panel is Tg(elavl3:GCaMP6f). For easier visualization of noradrenergic cells, skin autofluorescence was removed manually in the top-left panel. (B) Adrenergic receptor 1Bb expression visualized through in situhybridization. The lateral hindbrain (L-MO) showed high levels of adra1Bb receptor expression (arrows). The receptors can also be seen to line the astrocytic processes that run medial-lateral, consistent with RNA-seq results (see Table S2). The projection is over a 40 μm thick section. (C) Maximum intensity projection over 50 μm at the level of the L-MO of a Tg(gfap:CoChR-eGFP); Tg(net:tdTomato) fish that was expanded 4× through expansion microscopy to show a dense network of noradrenergic fibers expressing the norepinephrine transporter (NET) intertwined with glial processes in the L-MO. The section also shows the cell bodies of noradrenergic neurons (yellow arrows) located at the along the length of the medulla showing that indeed, noradrenergic neurons of the medulla oblongata (NE-MO) project to the L-MO. (D) Photostimulating NE-MO can briefly potentiate swimming. In closed-loop, optogenetically stimulating NE-MO first increased swim vigor before it suppressed swimming. Top, single trials from an example fish. Bottom, mean swim power change from 3 example fish and the average from these 3 fish. Shaded region represents SEM. (E) Photostimulating NE-MO no longer suppresses swimming after ablation of radial astrocytes in L-MO. (F) Blocking α1 adrenergic receptors, but not α2 adrenergic receptors, abolishes the activation of radial astrocytes in L-MO by NE-MO stimulation. Optogenetic stimulation of NE-MO activates radial astrocytes in L-MO, and this activation was abolished by either adding a mixture of antagonists targeting multiple subtypes of adrenergic receptors (left, prazosin for α1, idazoxan for α2, propranolol for β), by an antagonist of α1 adrenergic receptors alone (middle), or by an antagonist of α1B adrenergic receptors alone (right), but not by an antagonist of α2 adrenergic receptors (middle). Shading represents SEM. (G) Puffing methoxamine, an agonist of the α1 adrenergic receptor, triggered calcium responses in radial astrocytes in L-MO (left). Puffing external solution didn’t trigger a response (right). (H) Calcium activity in the NE-MO represents swim failures (Figure 7A). Calcium activity in the LC also represents swim failures, but only on the subsequent swim bout; this response may be downstream of the response in the NE-MO. The signals were aligned by subtracting the fluorescence right before the swim onset. Shading represents SEM. |
Reprinted from Cell, 178(1), Mu, Y., Bennett, D.V., Rubinov, M., Narayan, S., Yang, C.T., Tanimoto, M., Mensh, B.D., Looger, L.L., Ahrens, M.B., Glia Accumulate Evidence that Actions Are Futile and Suppress Unsuccessful Behavior, 27-43.e19, Copyright (2019) with permission from Elsevier. Full text @ Cell