
- Title
-
Brd4 and P300 Confer Transcriptional Competency during Zygotic Genome Activation
- Authors
- Chan, S.H., Tang, Y., Miao, L., Darwich-Codore, H., Vejnar, C.E., Beaudoin, J.D., Musaev, D., Fernandez, J.P., Benitez, M.D.J., Bazzini, A.A., Moreno-Mateos, M.A., Giraldez, A.J.
- Source
- Full text @ Dev. Cell
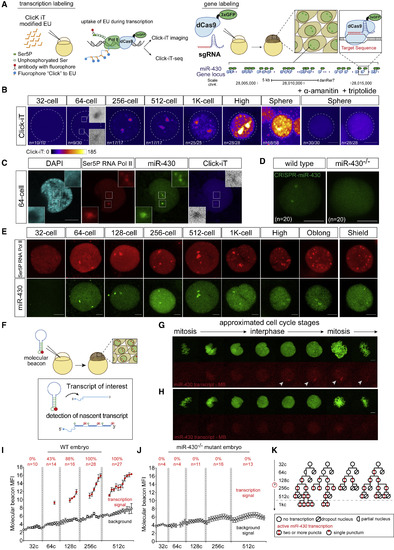
Zygotic Genome Activation Begins with the miR-430 Locus in a Gradual and Stochastic Manner (A) Schematic illustrating strategies used to visualize global transcription using Click-iT chemistry (left) and the miR-430 locus using CRISPR-dCas9-3xGFP (dCas9) (right). (B) Time-course imaging analysis of Click-iT-labeled zygotic transcription from 32-cell (∼1.75 hpf) to sphere stage (∼4 hpf). Representative nucleus from embryos treated with transcription inhibitors (α-amanitin and triptolide) is shown as negative control. Scale bar represents 5 μm. Nucleus is outlined using DAPI signal by a dotted line (n = the fraction of analyzed nuclei that shows the same transcriptional output as the representative nucleus). (C) Representative single-nucleus confocal images labeled with DAPI, phosphorylated Ser5 RNA Pol II (Ser5P RNA Pol II), miR-430 loci, and Click-iT (transcription). Scale bar represents 5 μm. Insets represent single-plane images of individual foci showing colocalized signal. (D) CRISPR-dCas9 labeling reveals two foci signals in wild-type (WT) embryos but not in miR-430−/− mutants that lack the miR-430 locus, demonstrating the signal specificity toward the miR-430 endogenous locus (n = number of analyzed nuclei across three embryos). Scale bar represents 5 μm. (E) Time-course analysis of single nuclei labeled for Ser5P RNA Pol II and dCas9 targeting the miR-430 locus from 32 cells to shield stage. Scale bar represents 5 μm. (F) Schematic illustrating in vivo labeling of nascent transcript of miR-430 in zebrafish embryos for live imaging using a molecular beacon (MBmiR430). (G and H) miR-430 transcription in vivo visualized by MBmiR430 during 128-cell-stage cell cycle in WT (G) or miR-430−/− mutant (H). Chromatin is labeled with Alexa Fluor 488 histone H1. Scale bar represents 5 μm. The approximated stage of the cell cycle is inferred by level of condensation of the chromatin and the shape of the nucleus as labeled by the Alexa Fluor 488 histone H1. MBmiR430 signals are highlighted by white arrows in the confocal images. miR-430 transcription is only detected in late interphase and early prophase (mitosis). Note the absence of MBmiR430 signal in miR-430−/− mutants. (I and J) MBmiR430 mean fluorescence intensity (MFI) quantified over each cell cycle in wild-type embryos (I) and miR-430−/− mutant embryos (J). Red dots represent the time points when MBmiR430 signal is detected; gray dots represent the nuclear background MBmiR430 signal (n = number of nuclei imaged; percentage represents the proportion of analyzed nuclei that display miR-430 transcription). (K) Representative cell-lineage tracing for miR-430 transcription. Transcription competency is acquired in a stochastic manner at 64-cell, and once gained is maintained in the daughter cells after cell division. |
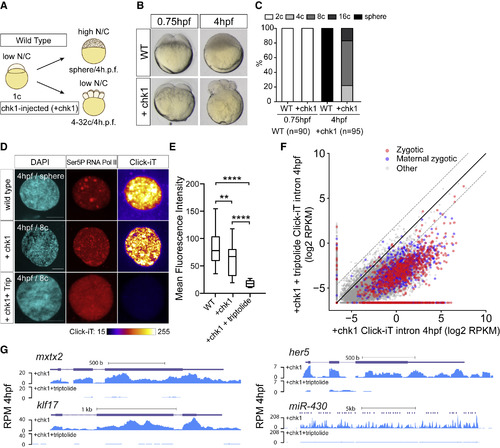
Genome Activation Occurs over Time, Independent of the N/C Ratio (A) Schematic illustrating the strategy to induce cell-cycle arrest by expressing chk1 in zebrafish embryos. (B) Transmitted light microscopy picture of wild-type (WT) and chk1-injected embryos (+chk1) at different times (hours post-fertilization, hpf). (C) Bar plot quantifying the number of cells in WT and chk1 (n = number of embryos analyzed). (D) Single-nucleus confocal image of DAPI, Ser5P RNA Pol II, and transcription (Click-iT) in different conditions as indicated at 4 hpf (+Trip, incubated with triptolide). Click-iT signal intensity is presented in a heatmap color scale. Scale bar represents 5 μm. (E) Box and whisker plots showing the mean fluorescence intensity for Click-iT signal in the conditions shown in (D) (∗∗∗∗p < 0.0001; ∗∗p = 0.0058; two-sample t test; WT [n = 129]; +chk1 [n = 21]; +chk1+triptolide [n = 15]). (F) Biplot comparing intron expression levels of genes in chk1-injected embryos with and without triptolide treatment reveals genome activation occurs in chk1-injected embryos at 4 hpf. The solid black line represents the diagonal, and the dashed lines represent 4-fold change. (G) Genome tracks representing normalized Click-iT-seq signal for examples of zygotic genes activated in chk1-injected embryos with (+chk1+triptolide) and without triptolide (+chk1). Reads per million (RPM) (STAR Methods). |
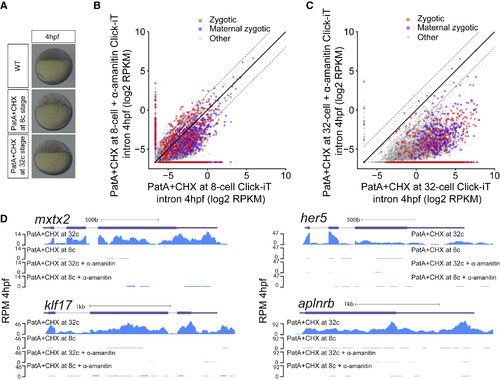
Transcriptional Competency of the Zygotic Genome Depends on the Translation of Maternal mRNAs (A) Embryos treated with pateamine A (PatA) and cycloheximide (CHX) at 8- (1.25 hpf) and 32-cell stage (1.75 hpf) arrest zebrafish embryos at 16- and 64-cell stage, respectively. (B and C) Biplot of Click-iT-seq RNA levels at 4 hpf comparing the level of transcription using intron signal. Embryos were treated with PatA+CHX at 8-cell stage (B) or at 32-cell stage (C), with and without α-amanitin. Dashed lines represent 4-fold change. (D) Genome tracks representing normalized Click-iT-seq signal in the embryos described in (B) and (C). Click-iT-seq was normalized by the total number of mitochondrial RNAs as an internal control. RPM (STAR Methods). |
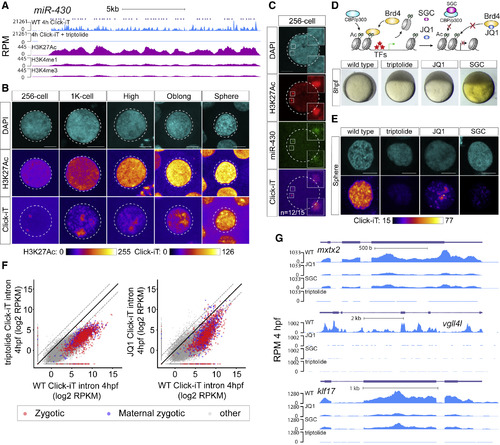
H3K27Ac Correlates with Transcriptional Activation during ZGA (A) Genome tracks representing normalized Click-iT-seq signal and histone mark level at the miR-430 locus. ChIP-seq data (Bogdanovic et al., 2012). RPM for Click-iT-seq/ChIP-seq (STAR Methods). (B) Time-resolved single-nucleus confocal imaging analysis of H3K27Ac from 256-cell to sphere stage reveals a positive correlation with the level of Click-iT signal. Both H3K27Ac and Click-iT signal intensity are presented in a heatmap color scale. Scale bar represents 5 μm. (C) Single-plane confocal image labeled for DAPI, H3K27Ac, dCas9-miR-430, and Click-iT. Note the colocalization of H3K27Ac with Click-iT-labeled transcription activity at the miR-430 locus (n = the fraction of analyzed nuclei that shows the same colocalization of H3K27Ac with Click-iT-labeled transcription at the miR-430 locus as the representative nucleus, >3 independent embryos are imaged). Scale bar represents 5 μm. (D) Schematic illustrating the selective pharmacologic inhibition of the activity of the BET bromodomain proteins (BRD2-4) and CBP/P300 by JQ1 and SGC, respectively (top). Embryos treated with JQ1 and SGC both arrest before gastrulation similar to those treated with triptolide, consistent with a loss of zygotic transcription (bottom) (Ac, H3K27 acetylation; TFs, transcription factors). (E) Click-iT imaging analysis in wild-type (WT), triptolide, JQ1, and SGC-treated embryos reveals a significant reduction in transcription by the treatment of JQ1 and SGC. Click-iT signal intensity is presented in a heatmap color scale. Scale bar represents 5 μm. (F) Biplot comparing intron expression levels of genes measured by Click-iT-seq in triptolide- (left) and JQ1-treated (right) embryos with WT embryos at 4 hpf. Dashed lines represent 4-fold change. (G) Genome tracks representing normalized Click-iT-seq signal measured at 4 hpf in WT, triptolide, JQ1, and SGC-treated embryos for examples of zygotic genes. RPM (STAR Methods). |
Reprinted from Developmental Cell, 49, Chan, S.H., Tang, Y., Miao, L., Darwich-Codore, H., Vejnar, C.E., Beaudoin, J.D., Musaev, D., Fernandez, J.P., Benitez, M.D.J., Bazzini, A.A., Moreno-Mateos, M.A., Giraldez, A.J., Brd4 and P300 Confer Transcriptional Competency during Zygotic Genome Activation, 867-881.e8, Copyright (2019) with permission from Elsevier. Full text @ Dev. Cell