
- Title
-
Redox Signaling via Lipid Peroxidation Regulates Retinal Progenitor Cell Differentiation
- Authors
- Albadri, S., Naso, F., Thauvin, M., Gauron, C., Parolin, C., Duroure, K., Vougny, J., Fiori, J., Boga, C., Vriz, S., Calonghi, N., Del Bene, F.
- Source
- Full text @ Dev. Cell
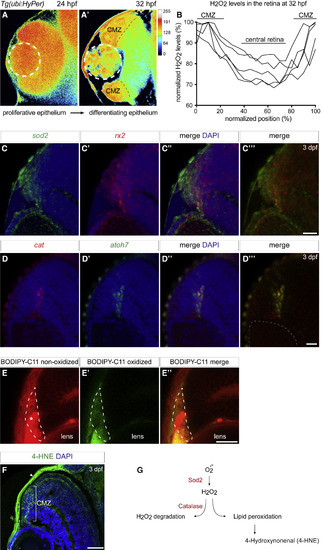
H2O2 Production and Scavenging and Lipid Peroxidation Dynamic during Retinal Development (A–B) H2O2 levels change in relation to retinal development revealed by the reporter line Tg(ubi:HyPer). The H2O2 levels are inferred from the YFP500 over YFP420 excitation ratio of HyPer. (A) and (A’) Optical section of a Tg(ubi:HyPer) retina at 24 hpf shows homogeneous high levels of H2O2 throughout the proliferative epithelium. At 32 hpf, H2O2 content decreased in the central part of the tissue and remained high in the ciliary marginal zone (CMZ) as confirmed by normalized quantification of H2O2 levels at this stage (B). (C–C’’’) Sod2 is expressed in stem and retinal progenitor cells within the domain of rx2 at 3 days postfertilization (dpf). Confocal sections through the central retina of wild-type embryos hybridized with both sod2 (green) and rx2 (red) antisense RNA probes. (D–D”’) Catalase is expressed in the domain of atoh7 in cycling retinal progenitor cells at 3 dpf. Confocal sections through the central retina of wild-type embryos hybridized with both catalase (red) and atoh7(green) antisense RNA probes. Retinae were counterstained with the nuclear marker DAPI (blue). White dashed lines delimitate the lens. (E–E”) Lipid peroxidation induced by ROS was detected using the BODIPY-C11 probe. Frontal confocal optical section of 3 dpf retinae treated with BODIPY-C11. (E) Non-oxidized BODIPY-C11 is shown in red and could be detected in the entire retinal tissue and enriched in the blood vessel adjacent to the retina (asterisk). (E′) Oxidized BODIPY-C11 is shown in green and was only detected at the outermost edge of the CMZ surrounded by white dashed lines. The merge is shown in (E”). (F) The lipid peroxidation end marker 4-HNE was found enriched in the CMZ of the 3 dpf zebrafish retina as revealed by immunohistochemistry (green) on 3 dpf frontal retinal cryosection counterstained with DAPI (blue). The white arrow points at 4-HNE staining at the surface of the skin where high oxidative stress processing occurs as expected. Scale bars: 20 μm in (C)–(C’’’), (D)–(D”’), and (E)–(E”) and 100 μm in (F). (G) Schematic representation of H2O2 scavenging via catalase coupled with the lipid peroxidation pathway and the downstream production of 4-HNE as secondary messenger. EXPRESSION / LABELING:
|
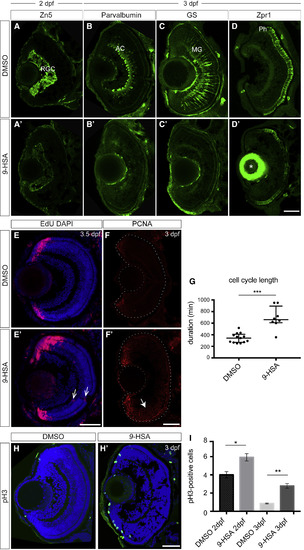
9-HSA Exogenous Administration Leads to Defects in Retinal Progenitor Cell Differentiation and to an Increase in Proliferation in the Retina (A–D’) 9-HSA exogenous administration leads to defects in differentiation during retinal development for all cell types analyzed. (A)–(A’) Immunohistochemistry of anti-Zn5 (green) labeling retinal ganglion cells (RGCs) on 2 days post-fertilization (dpf) frontal retinal cryosections from DMSO-treated (A) and 9-HSA-treated (A’) embryos. No RGC labeling was observed in the central part of the retina at 2 dpf in 9-HSA treated in comparison to DMSO-treated control retinae. (B)–(B’) Immunohistochemistry of anti-Parvalbumin (green) labeling amacrine cells (AC) and displaced AC on 3 dpf frontal retinal cryosections from DMSO-treated (B) and 9-HSA-treated (B’) embryos. Similar to RGCs, no ACs or displaced ACs were observed in 9-HSA-treated in comparison to DMSO-treated control retinae. (C)–(C’) Immunohistochemistry of anti-GS (green) labeling Müller glia cells (MGs) on 3 dpf frontal retinal cryosections from DMSO-treated (C) and 9-HSA-treated (C’) embryos revealed no MG differentiation in 9-HSA-treated in comparison to the DMSO control retinae. (D)–(D’) Immunohistochemistry of anti-Zpr1 (green) labeling photoreceptor cells (Ph) on 3 dpf frontal retinal cryosections from DMSO-treated (D) and 9-HSA-treated (D’) embryos. No Zpr1 labeling was observed in the central part of 9-HSA-treated retinae compared to DMSO-treated control retinae, where Zpr1-positive Ph could be detected within the outer nuclear layer of the 3 dpf retinal tissue. Asterisk in (D’) indicates unspecific antibody trapping in the lens. (E–I) 9-HSA exogenous administration leads to an increase in proliferation in the retina. (E)–(E’) EdU incorporation assay at 2.5 days postfertilization (dpf) in DMSO-treated control and 9-HSA-treated embryos detected by immunohistochemistry after 24 h shows an increase in the number of cells that actively replicated their DNA (S phase, red) during these 24 h at 3.5 dpf in the ciliary marginal zone, which was expanded in the 9-HSA-treated retinae. Nuclear counterstaining was also performed on these retinal sections by DAPI labeling (blue). (F)–(F’) Immunohistochemistry of anti-PCNA (red) labeling cells in S phase of the cell cycle on 3 dpf frontal retinal cryosections. 9-HSA-treated retinae showed an expanded PCNA labeling in the ciliary marginal zone and in the central retina (white arrow) in comparison to DMSO-treated control retinae at 3 dpf. (G) Quantification of the cell-cycle duration between two S phases of PCNA-GFP-positive RPCs from 9-HSA- and DMSO-injected embryos from 32 to 48 hpf. Time was measured in min. A significant increase in the cell-cycle length of RPCs from 9-HSA-injected embryos was observed (345.5 ± 23.24 min for DMSO in n = 13 cells compared to 691.3 ± 68.06 min for 9-HSA in n = 8 cells, p value: 0.0003 depicted as ∗∗∗). Statistical significance was determined using a Mann-Whitney U test. (H–H’) Immunohistochemistry of anti-pH3 (green) labeling of cells in M phase of the cell cycle on 3 dpf frontal retinal cryosections counterstained with the nuclear marker DAPI (blue). 9-HSA-treated retinae showed a higher number of mitotic cells in comparison to DMSO-treated control retinae at 3 dpf. (I) Quantification of the mitotic index at 2 and 3 dpf shows a significant increase in the percentage of pH3-positive cells in 9-HSA-treated retinae with respect to DMSO-treated control retinae at 2 and 3 dpf (n = 5, p value: 0.0176 at 2 dpf and n = 4, p value: 0.0060 at 3 dpf). Statistical significance for this quantification was determined using Student’s t test and depicted as: ∗p value < 0.05; ∗∗ p value < 0.01. Scale bars, 50 μm. EXPRESSION / LABELING:
PHENOTYPE:
|
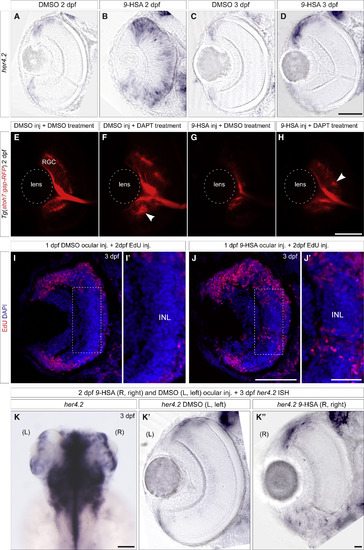
9-HSA Affects RPC Proliferation by Activating Notch Pathway (A–D) Expression analyses of the Notch target gene her4.2 at 2 and 3 days postfertilization (dpf) in DMSO-treated (respectively, (A) and (C)) and 9-HSA-treated retinae (respectively, (B) and (D)) reveal an increase in the expression of her4.2 in retinae of 9-HSA-injected embryos. At 2 dpf, her4.2 transcripts could still be found in the central part of the retinal neuroepithelium of 9-HSA-injected embryos while already restricted to the forming ciliary marginal zone (CMZ) in the control embryos (A) and (B). At 3 dpf, the expression of her4.2 was expanded in the CMZ in 9-HSA-treated retinae in comparison to the DMSO-injected embryos (C) and (D). (E–H) Inhibition of the Notch pathway by DAPT treatment rescues 9-HSA’s differentiation phenotype on retinal ganglion cells (RGCs) at 2 dpf. Tg(atoh7:gap-RFP) DMSO-injected (E) and (G) and 9-HSA-injected (F) and (H) embryos were respectively treated with either a DMSO control solution or with a DAPT supplemented solution. DMSO-injected embryos treated with DAPT presented a thicker RGC layer. RGCs formed rosettes (white arrow) and a thicker optic nerve (F). DAPT treatment of 9-HSA-injected embryos resulted in the rescue of RGC differentiation (H) (n = 6 retinae for each condition). The average thickness of the RGC layer size was quantified for all conditions and we found that DAPT treatment increase significantly RGC layer thickness regardless of 9-HSA injection (in (G) versus (H): 10.31 μm ± 0.1643 in n = 3 and 30.22 μm ± 1.586 in n = 4, p value: 0.001, unpaired Student’s t test). (I–K”) (I–J’) Intraocular injections of 9-HSA lead to an increase in proliferation of RPCs in the central part of the tissue compared to DMSO-injected retinae. 1 dpf embryos were injected intraocularly with 9-HSA in one eye and DMSO in the other eye (in n = 10 retinae). The injections were followed by an EdU incorporation assay at 2 dpf, and the effect of 9-HSA local retinal treatment on RPC proliferation was assessed at 3 dpf. Compared to the DMSO-injected eyes where almost all cells were EdU negative in the differentiated central part of the retina, retinae injected with 9-HSA still presented a high number of EdU-positive cells in this part of the tissue (K)–(K”). Intraocular injection of 9-HSA and DMSO in the right (R) and left (L) eye, respectively, of 2 dpf embryos followed by an in situ hybridization on her4.2 at 3 dpf. 9-HSA ocular injection leads to a striking increase of her4.2 expression in the central right retina and an expansion of its expression domain in the CMZ (K’) in comparison to DMSO-control-injected left retina (K”) (in n = 20 injected embryos). Scale bars, 50 μm in (A)–(I), (J), and (K’)–(K”); 20 μm in (I’) and (J’); and 100 μm in (K). EXPRESSION / LABELING:
PHENOTYPE:
|

9-HSA Induces RPCs Proliferation via the Activation of Canonical Wnt Signaling Expression analysis of the c-myc and cyclinD1 Wnt targets at 2 and 3 days postfertilization (dpf) in DMSO-treated (respectively, (A), (E), (C), and (G)) and 9-HSA-treated retinae (respectively (B), (F), (D), and (H)). (A–D) Comparative in situ hybridization revealed an increased expression of c-myc in the CMZ and in the central part of the 9-HSA-treated retinae in comparison to DMSO-treated control retinae at 2 and 3 dpf. (E–H) Similarly to c-myc, comparative analysis of cyclinD1 expression in DMSO-treated and 9-HSA-treated retinae showed an increased expression of cyclinD1 in the retinae embryos injected with 9-HSA in comparison to DMSO control retinae. (I) Quantitative real-time PCR of c-myc, cyclinD1, her4.2 and p27expression levels in 2 dpf 9-HSA-injected embryo heads versus DMSO-injected embryo heads (n = 3 for all conditions; her4.2 fold increase of 4.117 SEM ± 0.6289, p value = 0.0384; c-myc fold increase of 2.059 SEM ± 0.1231, p value = 0.0132; cyclinD1 fold increase of 1.814 SEM ± 0.1441, p value = 0.0299; p27 fold increase of 0.5461 SEM ± 0.1119, p value = 0.0557). Statistically significant was using a Student’s t test and depicted as: ∗p value < 0.05; ns = nonsignificant. Scale bar, 50 μm. EXPRESSION / LABELING:
PHENOTYPE:
|
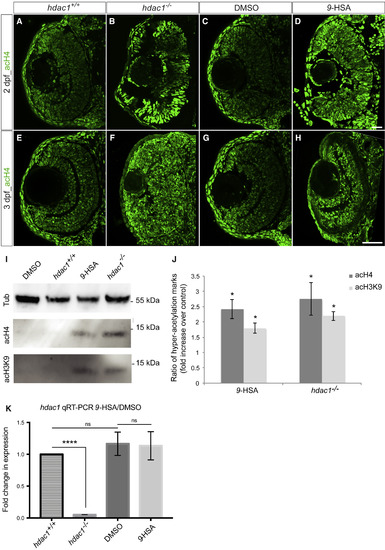
9-HSA Inhibits HDAC1 Enzymatic Activity In Vivo in the Retina (A–H) 9-HSA-treated and hdac−/− mutant retinae showed an increase in histone H4 hyperacetylation marks in comparison to wild-type (hdac1+/+) and DMSO-treated retinae at 2 and 3 days postfertilization (dpf). Immunohistochemistry of anti-hyperacetylated histone H4 (acH4, green) on 2 and 3 dpf frontal retinal cryosections. (I) Western blot analysis of histone H4 and histone H3 hyperacetylation marks (acH4 and acH3K9 respectively) from 3 dpf DMSO-treated, wild-type (hdac1+/+), 9-HSA-treated, and hdac1−/− whole embryo lysates showed an increase in both marks in 9-HSA-treated and hdac1−/− whole embryo lysates. (J) Western blot quantification of hyperacetylation of the histone 4 (acH4) and histone 3 (acH3K9) marks. Data are presented as ratios of 9-HSA-treated over DMSO-treated embryos and hdac1−/− mutant over wild-type (hdac1+/+). Values are means ± standard error of three independent samples. (K) Quantitative real-time PCR of hdac1 expression level in 2 dpf 9-HSA, DMSO-injected embryos as well as hdac1−/− and wild-type sibling (hdac1+/+) embryos was performed. No difference could be detected in the level of expression of hdac1 between both conditions in contrast to the expected loss of hdac1 expression in the hdac1 mutant (n = 3 for all conditions; p value = 0.9216 for 9-HSA/DMSO, p value < 0.0001 for hdac1 mutant/wild-type sibling. Statistical significance was determined using a Student’s t test and depicted as: ∗p value < 0.05; ns = nonsignificant. Scale bars, 20 μm in (A)–(D) and 50 μm (E)–(H). EXPRESSION / LABELING:
PHENOTYPE:
|
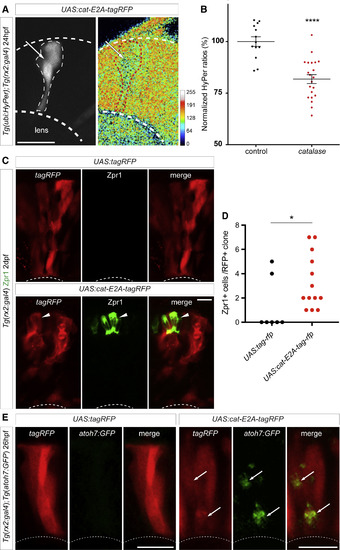
Catalase Overexpression in RPCs Is Sufficient to Trigger Their Premature Differentiation (A) Early catalase overexpression in rx2-expressing retinal progenitor cells (RPCs) leads to a decrease of H2O2 levels in RPCs at 24 h postfertilization (hpf) as revealed by the HyPer transgene reporting the endogenous levels of H2O2 of UAS:catalase-E2A-tagRFP (UAS:cat-E2A-tagRFP) injected in the double transgenic Tg(ubi:HyPer);Tg(rx2:gal4) embryos (white arrow and red dash line). (B) Normalized quantification of H2O2 levels in catalase-expressing (RFP-positive) clones at 24 hpf (catalase, n = 21 RPCs) and neighboring cells RFP-negative (control, n = 13 RPCs). p value < 0.0001, depicted as ∗∗∗∗, unpaired Student’s t test. (C) Early catalase overexpression by injection of UAS:catalase-E2A-tagRFP in Tg(rx2:gal4) RPCs led to the premature differentiation of their deriving cells as revealed by the late photoreceptor marker Zpr1 (white arrowhead, Zpr1+ Ph) in contrast to control UAS:tagRFP-injected RPCs. (D) Quantification of Zpr1-positive cells in UAS:tagRFP control clones and UAS:cat-E2A-tagRFP expressing clones revealed a significant increase in the number of Zpr1-positive cells in clones that expressed catalase (n = 7 retinae for UAS:tagRFP control and n = 13 retinae for UAS:cat-E2A-tagRFP, p value = 0.0255, Mann-Whitney U test). Medians for both conditions are shown (0 for UAS:tagRFP control and 2 for UAS:cat-E2A-tagRFP). (E) UAS:catalase-E2A-tagRFP construct was injected in double transgenic Tg(rx2:gal4);Tg(atoh7:GFP) embryos at 1-cell stage and the effect on atoh7:GFP expression was assessed at 26 hpf, before the normal onset of atoh7 expression. An induction of atoh7:GFPexpression in the RFP-positive clones expressing catalase in the dorsal retina could be observed, whereas no GFP could be detected in UAS:tagRFP-control-injected retinae (n = 10 retinae). Scale bars, 10 μm in (A) and (C) and 20 μm in (E). |

Catalase Endogenous Expression Was Also Required for the Switch of RPC from Proliferation to Differentiation during Normal Retinal Development (A and B) Catalase null-mutant embryos have an increased number of proliferative cells in comparison to their wild-type siblings as observed by EdU incorporation from 2 to 3 days postfertilization (dpf). This increase was particularly striking in the region of the central retina, where by 2 dpf post-mitotic neurons are located in normal condition (GCL, ganglion cell layer; INL, inner nuclear layer; Ph, photoreceptor cell layer; and CMZ, ciliary marginal zone). Scale bars, 35 μm in (A) and (B). PHENOTYPE:
|
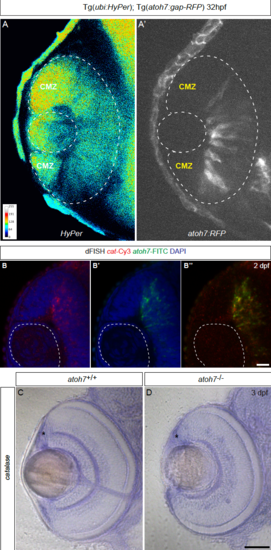
(A – B) H2O2 levels are decrease in differentiated cells, related to Figure 1. Tg(ubi:HyPer);Tg(atoh7:RFP) embryos imaged at 32 hours post-fertilization (hpf) show that as differentiation starts from the center of the tissue to its periphery, H2O2 levels are decrease where cells are differentiating and remain at high level at the periphery where the future ciliary marginal zone (CMZ) is forming. (B – B’’) At 2 dpf, catalase and atoh7 are expressed in the central retina transiently. (C – D) Catalase expression is independent from Atoh7 function in the retina. Comparative in situ hybridization at 3 dpf of catalase expression in wild type (C) and atoh7-/- mutant retinae (D) reveals that catalase is expressed in the absence of Atoh7 (asterisks, CMZ). Scale bar (B – B”) = 20 μm (C – D) = 100 μm. |
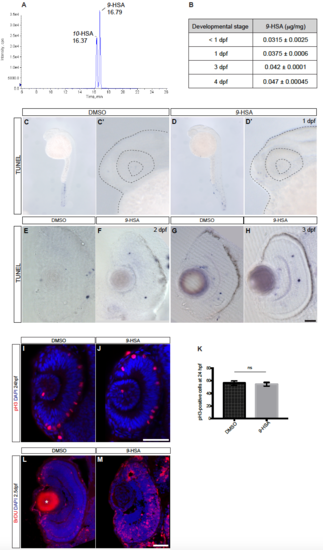
Exogenous administration of the endogenously produced lipid peroxidation product 9-HSA does not trigger apoptosis in the retina and promotes proliferation from 1 dpf in the zebrafish retina, related to Figure 2. (A) Liquid chromatography tandem mass spectrometry (LC-ESI-MS/MS) chromatogram of 9-HSA and 10-HSA. The reverse phase chromatographic separation efficiency was evaluated by analyzing simultaneously 9-HSA and its isomer 10- HSA. (B) Quantification of 9-HSA endogenous amounts in zebrafish embryos of different developmental stages: prior to 1, 1, 3 and 4 days post-fertilization (dpf). An increase in the content of 9-HSA during development was observed. Results are expressed in μg/mg of lipid extract. (C – H) 9-HSA exogenous administration does not trigger apoptosis in the retina at 1, 2 and 3 days post-fertilization. DMSO –treated control (C, C’, E and G) and 9-HSA –treated retinae (D, D’, F and H) show no difference in the number of apoptotic cells at 1, 2 and 3 days post-fertilization (dpf) as revealed by a cell death TUNEL assay. (I – M) 9-HSA exogenous administration leads to an increase in proliferation in the retina from 1 day postfertilization. (I – J) Frontal confocal optical section of an immunohistochemistry of anti-pH3 (red) labeling cells in M-phase of the cell cycle on 24 hours post-fertilization (dpf) DMSO and 9-HSA injected embryos and counterstained with the nuclear marker DAPI (blue). (K) Quantification of the mitotic index at 24 hpf shows no difference in the number of pH3- positive cells in 9-HSA –treated retinae with respect to DMSO –treated control retinae (n = 6 for each condition. 56.33 SEM ± 0.1441 pH3-positive cells in DMSO control retinae and 54.5 SEM ± 2.895 pH3-positive cells in 9-HSA injected retinae, p-value = 0.6849, depicted as ns = non significant). An unpaired Welch’s t-test was used. (L – M) BrdU incorporation assay at 2 days post-fertilization (dpf) in DMSO-treated control and 9-HSA –treated embryos detected by immunohistochemistry after 12 hours shows a strong increase in the number of cells that actively replicated their DNA (S-phase, red) during these 12 hours. Nuclear counterstaining was also performed on these retinal sections by DAPI labeling (blue). Asterisk in (L) indicates unspecific antibody trapping in the lens. Scale bars: (C – F) = 20 μm, (I – J) = 50 μm, (L – M) = 20 μm. |
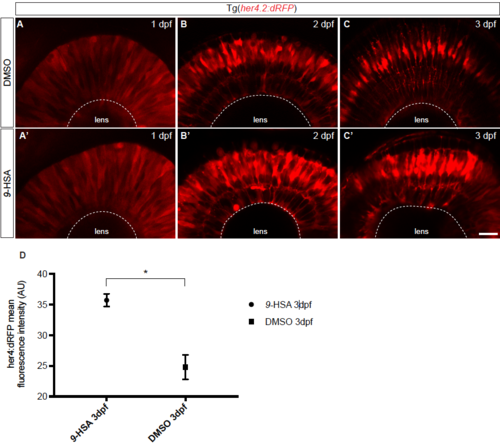
Tg(her4.2:dRFP) embryos injected with 9-HSA display increased RFP expression from 2 to 3 days post-fertilization, related to Figure 3. Tg(her4.2:dRFP) embryos were injected at 1-cell stage with either 9-HSA or DMSO. The effect of the injection on the expression level of her4.2 was assessed at 1, 2 and 3 days post-fertilization (dpf). At 1 dpf, no difference could be observed between the retinae of 9-HSA and DMSO injected embryos (A – A’). At 2 and 3 dpf, an increased expression of her4.2:dRFP could be observed in the retinae of 9- HSA in comparison to DMSO injected embryos of the same developmental stage (B – C’). (D) Quantification of the her4:dRFP fluorescent intensity at 3 dpf showed a significant increase in 9-HSA injected retinae of the dRFP signal compared to the control DMSO injected retinae (35.71 SEM ± 1.038 AU for 9-HSA and 24.79 SEM ± 2.005 AU for DMSO injected embryos, p-value: 0.0168, unpaired Welch’s t-test). Scale bar (A – C’) = 20 μm. |
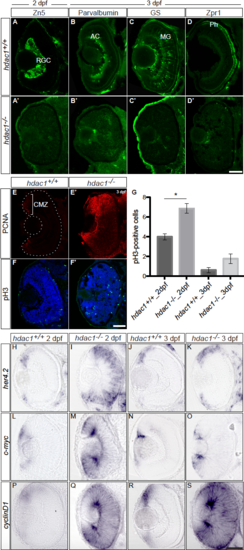
Hdac1 loss-of-function results in the activation of Notch and Wnt signaling pathways in the retina leading to an increase in the proliferation of retinal progenitor cells and differentiation defects for all retinal cell types, related to Figures 2, 3 and 4. (A – D’) Hdac1 loss-of-function results in a lack of differentiation in all cell types analyzed. (A – A’) Immunohistochemistry of anti-Zn5 (green) labeling retinal ganglion cells (RGC) on 2 dpf frontal retinal cryosections from wild type (hdac1+/+, A) and hdac1-/- mutant (A’) embryos. No RGC labeling could be observed in the central part of the retina at 2 dpf in 9-HSA -treated and hdac1-/- mutant retinae in comparison to wild type and DMSO-treated control retinae. (B – B’) Immunohistochemistry of anti-Parvalbumin (green) labeling amacrine cells and displaced amacrine cells (AC) on 3 dpf frontal retinal cryosections from wild type (hdac1+/+, B) and hdac1-/- mutant (B’) embryos. Similarly to RGCs, no amacrine cells or displaced amacrine cells could be observed in hdac1-/- mutant retinae in comparison to wild type retinae. (C – C’) Immunohistochemistry of anti-GS (green) labeling Müller glia cells (MG) on 3 dpf frontal retinal cryosections from wild type (hdac1+/+, C) and hdac1-/- mutant (C’) embryos shows no MG differentiation in hdac1-/- mutant retinae in comparison to the control retinae. (D – D’) Immunohistochemistry of anti-Zpr1 (green) labeling photoreceptor cells (Ph) on 3 dpf frontal retinal cryosections of wild type (hdac1+/+, D) and hdac1-/- mutant (D’) embryos. No Zpr1 labeling could be observed in hdac1-/- mutant retinae, while in wild type retinae Zpr1-positive Ph could be detected within the outer nuclear layer of the 3 dpf retinal tissue. Scale bars (A – D’) = 50 μm. (E – E’) Immunohistochemistry of anti-PCNA (red) labeling cells in S-phase of the cell cycle on 3 days post-fertilization (dpf) frontal retinal cryosections. Hdac1-/- retinae show an expanded PCNA labeling in the ciliary marginal zone (CMZ, bracket) and in the central retina in comparison to wild type sibling (hdac1+/+) retinae at 3 dpf. (F – F’) Immunohistochemistry of anti-pH3 (green) labeling cells in M-phase of the cell cycle on 3 dpf frontal retinal cryosections counterstained with the nuclear marker DAPI (blue). (G) The quantification of the number of pH3-positive cells in hdac1-/- in comparison to hdac1+/+ retinae shows a significantly higher number of mitotic cells in comparison to wild type retinae at 2 dpf (n = 3 retinae per condition, Unpaired Welch’s t-test, p-value = 0.0335 depicted as *). (H – S) Hdac1 loss-of-function results in the activation of Notch and Wnt signaling pathways in the retina. Expression analysis of her4.2, c-myc, and cyclinD1 at 2 days post-fertilization (dpf) in wild type siblings (hdac1+/+, respectively H, L, P), hdac1-/- mutant embryos (I, M, Q) and at 3 dpf (hdac1+/+, respectively J, N, R and hdac1-/-, respectively K, O, S). All the genes had increased expression in the retinae of hdac1-/- mutant in comparison to hdac1+/+ wild type siblings. Transcripts at 2 dpf could still be detected in the central part of hdac1-/- retinae. At 3 dpf, expression cyclinD1 expression was retained in the entire retinal tissue of hdac1-/- embryos in comparison to hdac1+/+ wild type siblings where cyclinD1 transcripts were restricted to the ciliary marginal zone (R – S). At this same stage, her4.2 and c-myc expressions were increased and expanded at the periphery of the tissue in the retinae of hdac1-/- embryos in comparison to hdac1+/+ wild type sibling retinae (K – J and O – N respectively). Scale bar = 50 μm. EXPRESSION / LABELING:
PHENOTYPE:
|
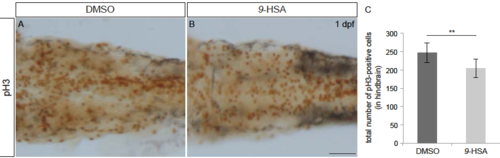
9-HSA exogenous administration leads to a decrease in proliferation in the hindbrain, related to Figure 5. pH3 staining (brown) labeling mitotic cells of whole-mount embryos injected with DMSO (control, A) and 9-HSA (B) at 1 day post-fertilization (dpf). (C) Quantification of the mitotic index in the hindbrain at 1 dpf reveals a significant decrease in the number of proliferative cells in the hindbrain of 9-HSA -treated compared to DMSO treated embryos (n = 7 for DMSO and n = 9 for 9-HSA –treated. Average number of pH3- positive cells in DMSO-treated hindbrain = 246, SD ± 26 and average number of pH3- positive cells in 9-HSA –treated hindbrain = 203, SD ± 25; p-value: 0.005). ** p-value < 0.01. Scale bar, 50 μm. PHENOTYPE:
|
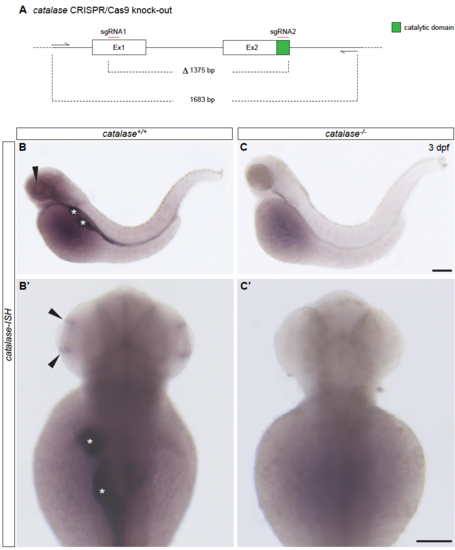
Generation of the zebrafish catalase-/- null-mutant CRISPR/Cas9 gene editing, related to Figure 7. (A) Schematic representation of the first two exons of the catalase gene. Exon 2 contains the catalytic domain of the protein. Each exon was targeted by a sgRNA. In particular, the catalytic site in Exon 2 was targeted by one of the 2 chosen gRNA in order to efficiently disrupt it. The CRISPR/Cas9 induced mutation led to the deletion of a total of 1375 base pairs (bp), causing the removing of the catalytic domain and a frame shift in the following exon that led to the appearance of premature stop codons. (B – C’) The generated mutation caused a non-sense mediated decay of catalase mRNA as shown by in situ hybridization. In contrast to catalase+/+ embryos, no signal could be detected in catalase-/- at 3 dpf in the ciliary marginal zone (black arrows), in the gut and liver (white asterisks). Scale bars, 100 μm. |
Reprinted from Developmental Cell, 50(1), Albadri, S., Naso, F., Thauvin, M., Gauron, C., Parolin, C., Duroure, K., Vougny, J., Fiori, J., Boga, C., Vriz, S., Calonghi, N., Del Bene, F., Redox Signaling via Lipid Peroxidation Regulates Retinal Progenitor Cell Differentiation, 73-89.e6, Copyright (2019) with permission from Elsevier. Full text @ Dev. Cell