- Title
-
Agouti-Related Protein 2 Is a New Player in the Teleost Stress Response System
- Authors
- Shainer, I., Michel, M., Marquart, G.D., Bhandiwad, A.A., Zmora, N., Ben-Moshe Livne, Z., Zohar, Y., Hazak, A., Mazon, Y., Förster, D., Hollander-Cohen, L., Cone, R.D., Burgess, H.A., Gothilf, Y.
- Source
- Full text @ Curr. Biol.
|
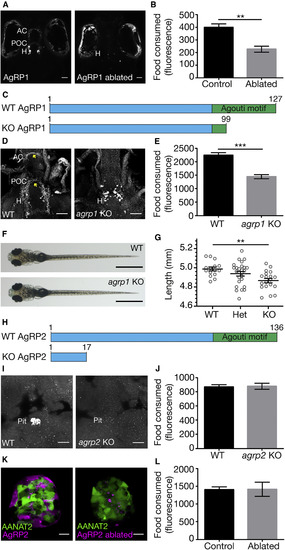
AgRP1, but Not AgRP2, Is a Regulator of Feeding Behavior (A) (Left) Dorsal view of 5-dpf larva expressing NTR-mCherry fusion protein in agrp1-expressing neurons. The cell bodies are located in the hypothalamus and project toward the post-optic commissure and the anterior commissure. (Right) The same larva at 8 dpf, after treatment with metronidazole. AgRP1 neurons were ablated, and the mCherry signal cannot be identified. AC, anterior commissure; H, hypothalamus; POC, post-optic commissure. Scale bars represent 50 μm. (B) Quantification of the food consumed by 8-dpf AgRP1 neuron-ablated larvae and NTR-negative sibling controls (t test; n = 6; p < 0.01). Values represent the mean fluorescence intensity ± SE. See also Figure S1. (C) Schematic illustration of the AgRP1 precursor in WT and agrp1 KO fish. The predicted WT AgRP1 contains 127 amino acids, including the C-terminal Agouti motif. The predicted mutated AgRP1 contains 99 amino acids and lacks the Agouti motif. (D) Immunostaining analysis of AgRP1 in WT (left) and agrp1 KO (right) larvae using zebrafish-specific AgRP1 polyclonal antibody. In the mutant, as apposed to WT, the truncated AgRP1 is not transported along the axons to reach the AC and POC (arrowheads). Ventral view is shown. Scale bars represent 50 μm. (E) Quantification of the food consumed by 8-dpf agrp1 KO and controls (progeny of WT siblings; t test; n = 9; p < 0.001). Values represent the mean fluorescence intensity ± SE. (F) Dorsal view of 8-dpf agrp1 KO and WT sibling. Scale bars represent 1 mm. (G) Body length measurements of 8-dpf agrp1 KO, their heterozygotes, and WT siblings (one-way ANOVA; n = 15–26; p < 0.01). Circles represent single measurements; horizontal lines represent the mean body length ± SE. (H) Schematic illustration of the AgRP2 precursor in WT and agrp2 KO fish. The predicted WT AgRP2 contains 136 amino acids, including the C-terminal Agouti motif. The predicted mutated AgRP2 contains only 17 amino acids and lacks the Agouti motif. (I) Immunostaining analysis of AgRP2 in WT (left) and agrp2 KO (right) larvae using the zebrafish-specific AgRP2 polyclonal antibody. Ventral view of the pituitary is shown. No signal is detected in pituitaries of mutated larvae. Pit, pituitary. Scale bars represent 10 μm. (J) Quantification of the food consumed by 8-dpf agrp2 KO and controls (progeny of WT siblings; t test; n = 6; p > 0.05). Values represent the mean fluorescence intensity ± SE. (K) (Left) Pineal gland of 3-dpf larva expressing NTR-mCherry fusion protein in agrp2-expressing cells and EGFP under the promoter of aanat2 (which marks the pineal photoreceptors) [20]. (Right) Same larva at 8 dpf is shown, after treatment with metronidazole. AgRP2 cells were ablated, and the photoreceptors were not damaged. Scale bars represent 10 μm. (L) Quantification of the food consumed by 8-dpf AgRP2 neuron-ablated larvae and NTR-negative sibling controls (t test; n = 6; p > 0.05). Values represent the mean fluorescence intensity ± SE. EXPRESSION / LABELING:
PHENOTYPE:
|
|
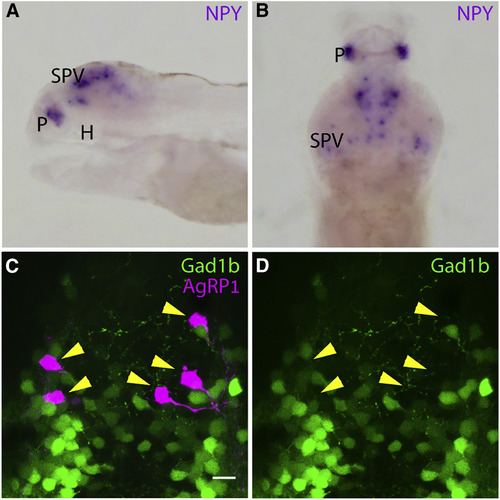
Zebrafish AgRP1 Neurons Do Not Co-express NPY or Gad1b (A) In situ hybridization (ISH) analysis of NPY in 5-dpf larva, lateral view; eyes were dissected. NPY is expressed in the stratum periventriculare layer of the optic tectum and in the pallium but is not detected in the hypothalamus. H, hypothalamus; P, pallium; SPV, stratum periventriculare. (B) ISH analysis of NPY in 5-dpf larva, dorsal view; eyes were dissected. NPY is expressed in the stratum periventriculare layer of the optic tectum and in the pallium. (C) Hypothalamus of 5-dpf agrp1:Gal4-VP16; UAS:nfsB-mCherry, gad1b:EGFP. The EGFP is not localized to AgRP1 neurons (arrowheads). Scale bar represents 10 μm. See also Video S1. (D) Same as (C), presentation of the EGFP layer only. The localization of the AgRP1 neurons is marked by arrowheads to demonstrate the absence of EGFP. EXPRESSION / LABELING:
|
|
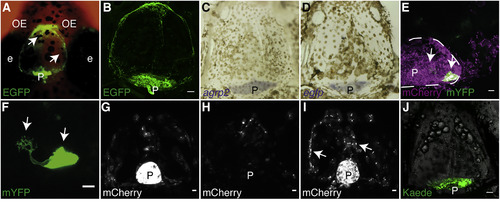
Pineal AgRP2-Expressing RPE-like Cells Are Secretory Cells (A) Dorsal view of a 21-dpf agrp2:EGFP fish head. The EGFP is not confined to the pineal and can be observed above the telencephalon (arrowheads). (B) Dissected skull of adult agrp2:EGPF fish, immunostained with an antibody against EGFP. Ventral view, anterior to top, is shown. The EGFP remains bound to the skull. Scale bar, 100 μm. (C) ISH of agrp2 (purple) performed on an adult skull. Ventral view (same as B), anterior to top, is shown. agrp2 mRNA is localized to the pineal gland. (D) ISH of egfp (purple) performed on an adult skull. Ventral view (same as B), anterior to top, is shown. egfp mRNA is localized to the pineal gland. (E) Dorsal view of a 21-dpf agrp2:Gal4-VP16; UAS:nfsB-mCherry; UAS:mYFP fish, focusing on the pineal gland with sparse mYFP labeling. The membrane-bound YFP (green) is confined to the pineal (arrowheads), and the mCherry can be found outside of the pineal, possibly secreted from the pineal region. Dashed line represents the circumference of the pineal gland. Scale bar, 10 μm. (F) Enlargement of (E) reveals the cellular architecture of AgRP2 cells, bearing branched microvilli-like structure (left arrowhead). Scale bar, 10 μm. (G) Dorsal view of a 7-dpf agrp2:Gal4-VP16; UAS:nfsB-mCherry fish larvae before laser ablation, focusing on the pineal gland and the telencephalic area. The mCherry is mainly detected in the pineal gland. Scale bar, 10 μm. (H) Same larva as (G), at 10-dpf, 3-day post laser-ablation. Dorsal view focuses on the pineal gland and the telencephalic area. The mCherry signal from the pineal is lost and is merely detected above the telencephalic region. Scale bar, 10 μm. (I) Dorsal view focusing on the pineal gland and the telencephalic area of 10-dpf agrp2:Gal4-VP16; UAS:nfsB-mCherry control larva with intact pineal gland. At this age, the mCherry signal can already be detected above the telencephalic area (arrowheads). Scale bar, 10 μm. (J) Dissected skull of adult agrp2:Gal4-Vp16; UAS:Kaede fish. Ventral view, anterior to top, is shown. The Kaede signal can only be detected in the pineal area. Scale bar, 100 μm. e, eye; OE, olfactory epithelium; P, pineal. |
|
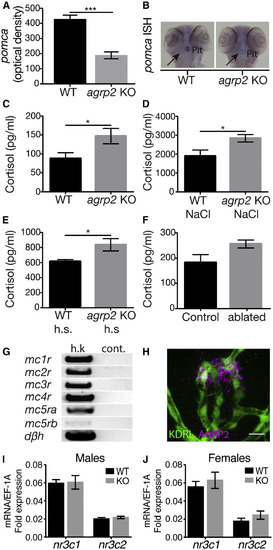
AgRP2 Is a Regulator of the Stress Axis (A) ISH analysis of pituitary pomca mRNA expression. pomca is significantly decreased in agrp2 KOs in comparison to their WT controls (t test; n = 22; p < 0.001). Values represent the mean optical density ± SE. (B) Representative pomca ISH signals of agrp2 KO and WT control. (C) Basal state cortisol levels were measured in agrp2 KOs and their WT controls (t test; n = 6; p < 0.05). Values represent the mean cortisol levels ± SE. (D) Cortisol levels of agrp2 KOs and their WT controls after 10 min of osmotic shock (250 mM NaCl; t test; n = 6; p < 0.05). Values represent the mean cortisol levels ± SE. (E) Cortisol levels of agrp2 KOs and their WT controls after 10 min of 36°C heat shock (h.s.) (t test; n = 6; p < 0.05). Values represent the mean cortisol levels ± SE. (F) Cortisol levels of AgRP2-ablated larvae and their controls (t test; n = 6; p = 0.056). Values represent the mean cortisol levels ± SE. (G) PCR analysis of melanocortin receptor expression in the head kidney, where the interrenal tissue is located. Dopamine beta hydroxylase (dβh) was used as a positive control for interrenal tissue cells. h.k., head-kidney; cont., negative control. (H) Immunostaining analysis of the pituitary vasculature using the zebrafish-specific AgRP2 antibody (magenta) and EGFP antibody in kdrl:EGFP larvae (green), which expresses EGFP in vascular endothelial cells. Scale bar represents 10 μm. (I) Real-time PCR analysis of glucocorticoid receptor or mineralocorticoid receptor expression in male pituitary glands, encoded by the nr3c1 and nr3c2, respectively (t test; n = 8; p > 0.05). (J) Real-time PCR analysis of glucocorticoid receptor or mineralocorticoid receptor expression in female pituitary glands, encoded by the nr3c1 and nr3c2, respectively (t test; n = 8; p > 0.05). |
|
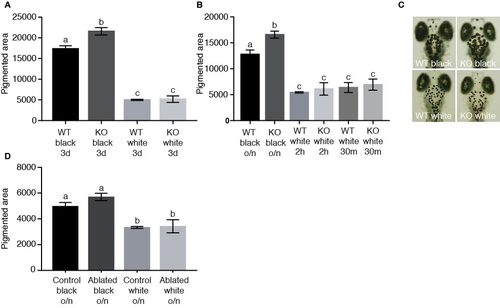
Aggregation and dispersion of melanosomes is normal in agrp2 KO and AgRP2 cell-ablated larvae. Related to Figure 4. (A) The pigmented area of 6-dpf larvae placed on a black or white background for 3 days. Pigmented area in agrp2 KO larvae was significantly higher on a black background, but did not differ when raised on a white background where both genotypes demonstrated equal aggregation of melanosomes (two-way ANOVA, n=25, p<0.01). Values represent mean pigmented area ± SE. (B) The pigmented area of 6-dpf larvae placed on a black background overnight (o/n) and then transferred to a white background for either 2 hours or 30 minutes, or kept on black background. On a black background, pigmented area was significantly higher in agrp2 KO, but when transferred to white background, both genotypes demonstrated equal aggregation of melanosomes, whether the adaptation was for 2 hours or 30 minutes (two-way ANOVA, n=30-35, p<0.01). Values represent mean pigmented area ± SE. (C) Representation of agrp2 KO and WT control melanosomes after 12 hours on black background, or after 30 minutes on white background. (D) The pigmented area of 6-dpf larvae placed on a black or white background overnight (o/n). Both AgRP2 ablated and their control larvae demonstrated equal aggregation or dispersion of melanosomes (two-way ANOVA, n=9, p<0.01). Values represent mean pigmented area ± SE |

