
- Title
-
Actin dynamics and the Bmp pathway drive apical extrusion of proepicardial cells
- Authors
- Andrés-Delgado, L., Ernst, A., Galardi-Castilla, M., Bazaga, D., Peralta, M., Münch, J., González-Rosa, J.M., Marques, I., Tessadori, F., de la Pompa, J.L., Vermot, J., Mercader, N.
- Source
- Full text @ Development
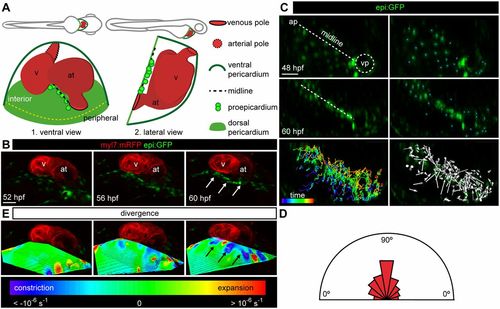
Constriction of the dorsal pericardium precedes proepicardium formation. (A) Scheme of lateral and ventral views of a 60 hpf zebrafish embryo (top) and heart (bottom). The lateral view is rotated by −90°. (B) 3D ventral view of heart region in an epi:GFP; myl7:mRFP embryo. epi:GFP+ cells (green) are present in the dorsal pericardium (DP) and proepicardium (PE), myl7:mRFP+ cells (red) form the myocardium. 3D projections from in vivo time lapse at different time points are shown. White arrows point to PE cells (see Movie 1). (C) First and last frame of an in vivo time lapse of DP cells in an epi:GFP embryo; the midline is shown by a dashed white line, blue dots indicate tracked cells. Full colored tracks label the first time frame in purple and the last in red. Arrows indicate overall direction of tracked cells. (D) The half-rose diagram shows the movement angles of tracked cells relative to the midline. (E) 3D projection of the divergence field calculated for the time-lapse video above. The calculated divergence values are represented by colors; purple-blue regions represent constriction and red regions represent expansion. Black arrows point to PE cell clusters. ap, arterial pole; at, atrium; hpf, hours post-fertilization; v, ventricle; vp, venous pole. DP digitally isolated in 3D projections. Shown is data from one imaged animal representative of three biological replicates. Scale bars: 50 µm. |
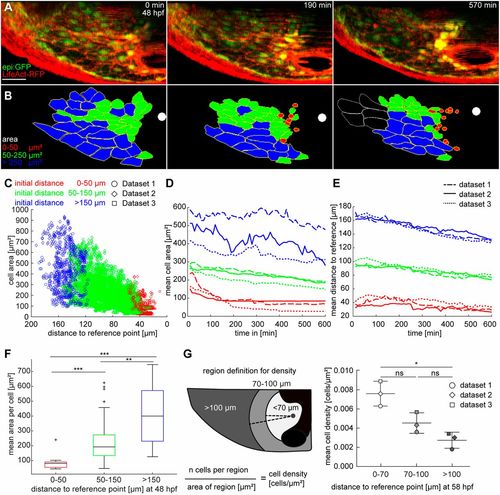
Dorsal pericardial cells reduce their area during displacement to the midline. (A) Maximum intensity projections from a time lapse using epi:GFP; βactin:LifeAct-RFPe2212Tg embryos from 48 hpf onwards. LifeAct-RFP (red) signal shows F-actin. (B) Color-coded segmentation of 47 cell shapes from time series in A. Segmentation was repeated every 10 min in 60 subsequent time frames (n=3 animals). White spots indicate the reference point on the midline. Last frame shows white outline for cells not included in the quantification (see Movie 2). (C) The scatter plot shows the area of each cell per time point against the distance to the reference location. Color code represents the initial distance to the reference point. The mean distance is drawn against the distance to reference. (D,E) Graphs describe tracking and analysis of each cell from three datasets, with mean cell area (D) and mean distance of each cell (E) drawn against time. Each dataset is split into three categories according to the initial distance of a cell to the reference point, indicated by the color code. The line style indicates different datasets. (F) Data are sorted into categories by the initial distance to the reference point; each category is averaged and represented in a boxplot. The box represents the 25-75th percentiles, and the median is indicated. The whiskers show minimum and maximum of observed values. Outliers are indicated by crosses. (G) At the last time point (58 hpf), the mean cell density within the DP was calculated 70 µm, 100 µm and >100 µm from the reference point. The principle of measurement is schematically represented on the left. Areas in which the signal intensity is weak owing to the heart tube (black) were excluded from the quantification. Data are means±s.d.; Kruskal–Wallis test. ns, not significant; *P<0.05; **P<0.01; ***P<0.001. hpf, hours post-fertilization. DP digitally isolated in maximum intensity projections. Data from three out of six biological replicates from two independent acquisitions. Scale bar: 50 µm. |
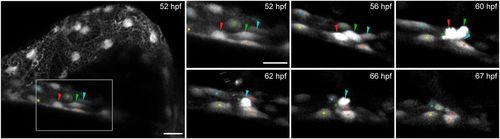
Collective cell movements and apical extrusion lead to proepicardium delamination. epi:GFP embryo in vivo time lapse. Maximum intensity projection of 22 µm. Left panel, overview of the pericardial cavity at 52 hpf. Right panels, zoomed views of the dorsal pericardium (DP) during proepicardium (PE) formation. Shown are frames of the time lapse from 52 to 67 hpf. Colored arrowheads, emerging PE cells. Colored asterisks, DP cells surrounding PE cells (shown is one out of 10 observed events, see also Movie 3). hpf, hours post-fertilization. Images from one out of 10 embryo from five independent acquisitions. Scale bar: 20 µm; zoomed images, 10 µm. |
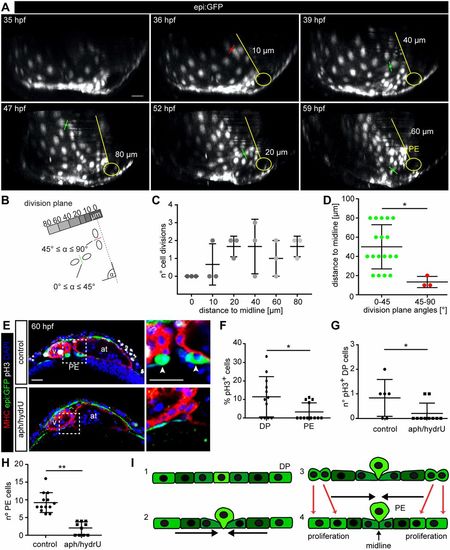
Proliferation of dorsal pericardial cells contributes to proepicardium formation. (A) 3D projection of six frames of an epi:GFP embryo in vivo time lapse (see also Movie 4). Division planes indicated with red (45°≤α≤90°) or green (0°≤α≤45°) lines. A representation of the midline and the venous pole is shown in yellow. The distance of the division to the midline is indicated. (B) Scheme showing the principle of measurements for distance and angles of division planes to midline. (C) Number of cell divisions during in vivo time-lapse imaging relative to their distance to midline (three embryos with 20 cell divisions each). (D) Angles of cell division planes and their distance relative to the midline. A-D, data from ≥10 biological and ≥2 technical replicates. (E) Immunostaining for GFP (green), Myosin heavy chain (red) and pH3 (white). DAPI counterstained nuclei (blue). Optical sections of a control heart or embryos treated with aphidilcolin and hydroxyurea (aph/hydrU). Zoomed view of the PE area on the right. Arrowheads, PE cells. (F) Percentage of pH3+ cells in the dorsal pericardium (DP) compared with the PE in control animals. (G) Quantification of total number of pH3+ cells in the DP. (H) Quantification of PE cell number. (I) Scheme of PE extrusion mechanism: (1) DP is a flattened mesothelium; (2) DP cells move towards the midline; (3) PE cells round up at the midline; (4) DP cell proliferation contributes to the constriction and PE cells finally extrude. Data are mean±s.d., Kruskal–Wallis test followed by multiple comparison test in C; two-tailed Student's t-test in D,F-H, *P<0.05; **P<0.01. at, atrium; hpf, hours post-fertilization; PE, proepicardium; v, ventricle. DP digitally isolated in 3D projections. E-H, representative data from 10 biological replicates out of one experiment. Scale bars: 20 µm. |