
- Title
-
Proteolytic and Opportunistic Breaching of the Basement Membrane Zone by Immune Cells during Tumor Initiation
- Authors
- van den Berg, M.C.W., MacCarthy-Morrogh, L., Carter, D., Morris, J., Ribeiro Bravo, I., Feng, Y., Martin, P.
- Source
- Full text @ Cell Rep.
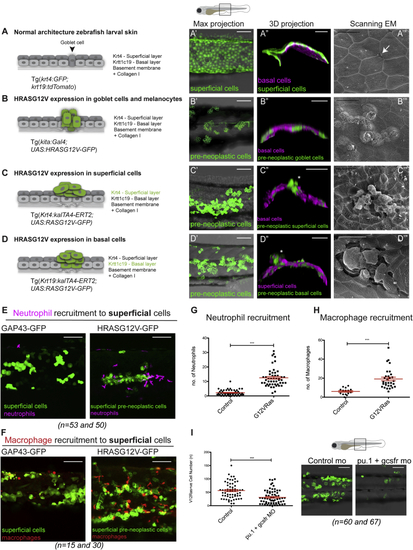
Zebrafish Skin Cancer Models and Immune Cell Recruitment (A) WT 3 dpf larval skin: superficial cell layer (dark gray in A, GFP [green] in A′ and A″) and basal cell layer (light gray in A, magenta in A″) with underlying basement membrane (BM). (A″′) Scanning electron microscopy shows a goblet cell (arrow in A and A″′, green in B) in the epidermis. (B) kita:RAS model. HRASG12V-GFP expressing goblet cells in 7 dpf larva over-proliferate (green in B, B′, and B″). Basal cells are in magenta (B″). Tracks of goblet cells by scanning electron microscopy (B″′). (C and D) K4:RAS and K19:RAS models. HRASG12V-GFP expression (48 h postinduction [hpi] of 4OHT) in superficial (C and C′) or basal (72 hpi) (D and D′) pre-neoplastic cells is shown in green. (C) HRASG12V-GFP-expressing superficial clones (basal cells shown in magenta) in 3 dpf larva (asterisk, C″) and scanning electron microscopy (72 hpi) (C″′). (D) HRASG12V-GFP-expressing basal clones in 5 dpf larva (superficial cells in magenta) (asterisk in D″ and scanning electron microscopy in D″′). (E–H) Mosaic expression of oncogenic HRASG12V in skin cells compared with control GAP-43 GFP expression results in recruitment of neutrophils (magenta; E) and macrophages (red; F) 48 hpi, quantified in (G) and (H), respectively. See also (I) Knockdown of both neutrophils and macrophages (with PU.1 and granulocyte colony stimulating factor [GCSF] MOs) inhibits superficial pre-neoplastic cells growth (GFP) in 48 hpi larvae. Scale bars: 100 μm (A′, A″, B′, B″, C′, C″, D′, D″, E, F, and I); 20 μm (A″′, B″′, C″′, and D″′). Graphs display mean ± SEM. |
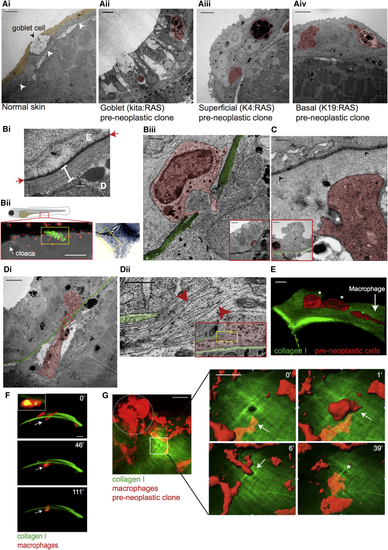
Correlative Light and Electron Microscopy of Immune Cells Entering the Epidermis (Ai) Transmission electron microscopy (TEM) of 5 dpf WT larval skin; superficial epidermal layer (sepia), basal layer beneath, and the basement membrane, visible as a thin dark line (arrowheads) and goblet cell. (ii) TEM of kita:RAS clone (16 dpf), and superficial (iii) and basal (iv) clones in 5 dpf (72 hpi) larvae, shows immune cells (false colored red) within the clones. (Bi) TEM of larval BMZ. Red arrows indicate the basement membrane; the white bar indicates collagen I, E is the epidermis above, and D is the dermis below the BMZ. (ii and iii) CLEM; confocal image (ii, lower left) and methylene blue-stained section (ii, right) show where clone and immune cell interactions take place (yellow boxes) near the cloaca (arrow in ii). (iii) Granulocyte (red) in a breach in the BMZ (green) beneath a goblet cell clone (see inset) in 10 dpf larva. (C) Neutrophil (red) protrusions surrounding bundled collagen I (asterisk) below the BM (arrowheads) beneath a pre-neoplastic superficial cell clone (in inset BM zone is colored in green) in 5 dpf (72 hpi) larva. (Di) A macrophage (red), containing collagen, spans a breach in the BM (green) beneath a basal cell clone in 5 dpf (72 hpi) larva. (ii) High-magnification view corresponding to yellow box in red inset, which, in turn, corresponds to red box in (i). Red arrowheads indicate collagen fibrils. (E) Confocal imaging of a 5 dpf/48 hpi larva shows a macrophage (red, see white arrow) above the collagen I layer (green) approaching two pre-neoplastic basal cells (red, see white asterisks). (F) Confocal imaging of a macrophage (white arrows) containing engulfed collagen (yellow) in the collagen I-GFP layer in 5 dpf (48 hpi) larva. Inset: a single z stack shows collagen I-GFP (yellow) within the macrophage. (G) Stills from a time-lapse video (minutes in top right corner) show a macrophage (red) squeezing through a pre-existing hole in the collagen I layer (green) beside a superficial pre-neoplastic clone on the left (red, dotted white circle) in 5 dpf (72 hpi) larva. See also Scale bars: 5 μm (Ai–Aiv, Biii and C [insets], Di, and G [video stills]); 500 nm (C); 100 nm (Dii); 1 μm (Dii [inset] and Biii); 10 μm (E and F); 20 μm (G); 500 nm (Bi); and 100 μm (Bii). |
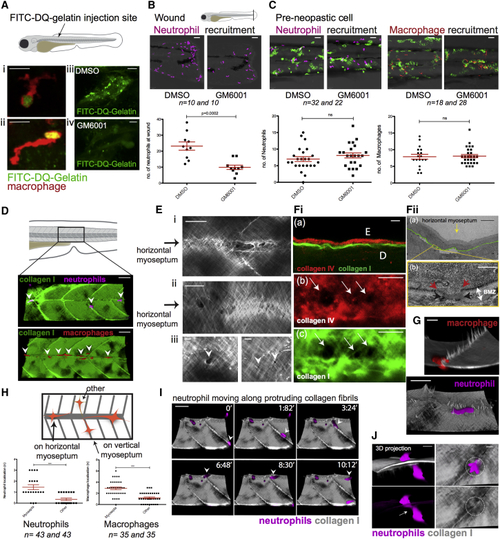
Weak Spots in the BM Barrier Layer Allow Opportunistic Crossing of Immune Cells into the Epidermis (A) De-quenched fluorescein isothiocyanate (FITC)-gelatin in 3 dpf larva indicates MMP activity (green or yellow) at the leading edge of macrophages (red; i and ii). GM6001 inhibits MMP activity in whole somite (iv versus iii). (B) GM6001 inhibits neutrophil recruitment to tail fin wound, but does not inhibit neutrophil (magenta) or macrophage (red) recruitment to pre-neoplastic cells in 3 dpf (24 hpi) larvae (C). See also (D) Neutrophils and macrophages preferentially move along the horizontal myoseptum (indicated with arrowheads) in wild-type 5 dpf larval skin. See also (E) Collagen along the horizontal myoseptum of 5 dpf larva shows altered structure and gaps or weak spots (i and ii). Higher-magnification view illustrates variation in size of gaps along the horizontal myoseptum (iii, white arrowheads). See also (Fi) Immunostaining of collagen I (green) and collagen IV (red) at the epidermal (E) dermal (D) interface (a) reveals concomitant holes in collagen IV (b) and collagen I (c) along the horizontal myoseptum of 5 dpf larvae. (ii) TEM of 5 dpf WT larval skin shows a gap through the BMZ at the horizontal myoseptum (yellow arrow in a). Red arrowheads indicate the margins of the BM gap; black arrows define margins of disrupted collagen I in the same location (b). (G) Macrophages (red, 14 dpf) and neutrophils (magenta, 5 dpf) crawling adjacent to collagen I fiber “tracks” (gray). (H) Schematic and quantification of neutrophils and macrophages within the flank of 3 dpf larvae. (I) Still series from a video shows neutrophil (magenta) migrating along the protruding collagen I fibers (gray) at the myosepta (arrowhead) in 5 dpf larva. See also (J) Neutrophil (magenta) squeezes (arrow) through collagen I at myoseptum in a larva 14 dpf. Scale bars: 10 μm (Ai, Aii, Fib, and Fic); 20 μm (Aiii, Aiv, Ei, Eii, G, and J); 5 μm (Eiii, Fia, and Fiia); 50 μm (B, C, D, and I); 400 nm (Fiib). Graphs display mean ± SEM. |
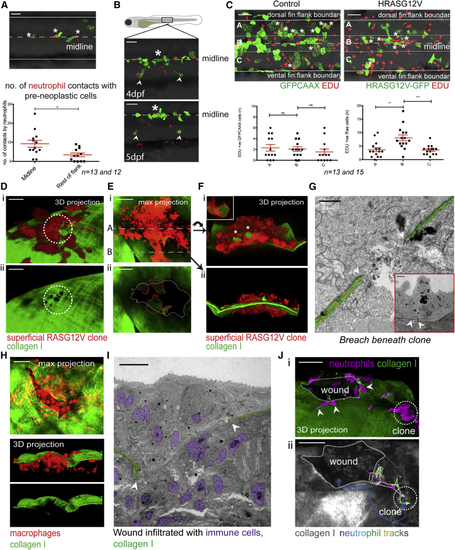
Immune Cells Access Epidermal Clones through Portals in the Basement Membrane (A) Neutrophil and pre-neoplastic cell contacts (asterisks) along the horizontal myoseptum compared with elsewhere in the flank 8 hpi, over a 3-h period. (B) Proliferation of clones (asterisk) along the horizontal myoseptum compared with clones farther away (arrowheads). (C) Example of EDU staining of control, GFPCAAX-expressing basal cells (left) versus GFP-expressing HRASG12V basal cells (right) at 18 hpi. Quantification of double EDU (red) and GFP +ve cells in indicated zones: A, B, and C. (D–G) Degradation of the BMZ beneath later stage pre-neoplastic cell clones. (Di) A superficial HRASG12V-expressing clone (red) on collagen I-GFP with holes in the collagen I layer immediately beneath the clone (white dotted circle, Dii) in a larva 6 dpf (96 hpi). (E) Degraded collagen I-GFP zone beneath a large HRASG12V-expressing superficial clone (red) in a larva 5 dpf (96 hpi; white dotted line in Eii). Lumps of collagen I within the pre-neoplastic cells are outlined (red dotted line). (Fi) A transverse 3D view of the clone along dotted line A in (Ei). GFP-collagen I within pre-neoplastic cells (asterisks and inset in Fi). See also (G) TEM shows BMZ degradation (white arrowheads) beneath a large HRASG12V-expressing superficial cell clone (120 hpi) in 6 dpf larvae. See also (H) Maximal projection confocal image of a flank wound in a larva 7 dpf, 2 days postinjury, shows a defect in the collagen I-GFP layer and recruited macrophages (red). 3D projection shows macrophages (red) below and above the matrix breach. (I) CLEM shows breach (arrowheads) in the BMZ (green) with invading immune cells (purple nuclei). (Ji) Neutrophils (magenta) escaping the wound (arrowheads) and crawling over collagen I layer toward pre-neoplastic superficial clone (dotted circle) as indicated by neutrophil tracks in (Jii). See also |