
- Title
-
The ubiquitin ligase PHR promotes directional regrowth of spinal zebrafish axons
- Authors
- Bremer, J., Marsden, K.C., Miller, A., Granato, M.
- Source
- Full text @ Commun Biol
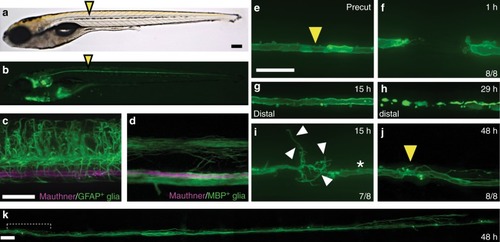
Robust and directional regrowth of Mauthner axons following laser-mediated transection. |
|
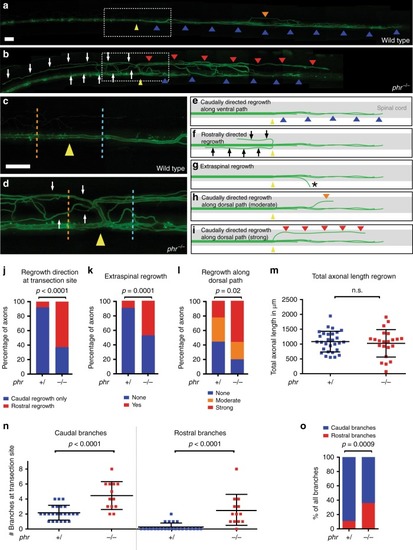
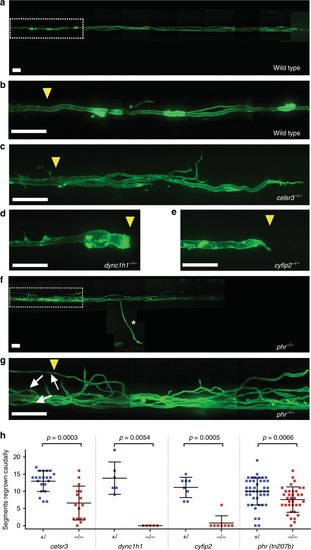
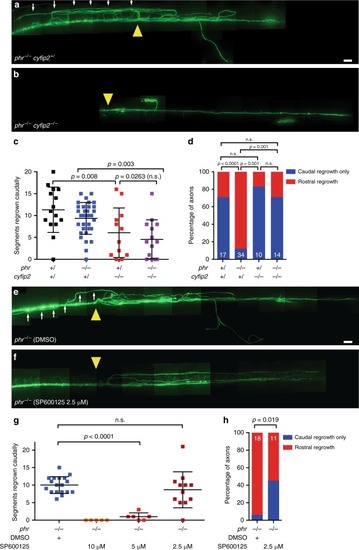
PHR promotes directional regrowth of Mauthner axons. PHENOTYPE:
|
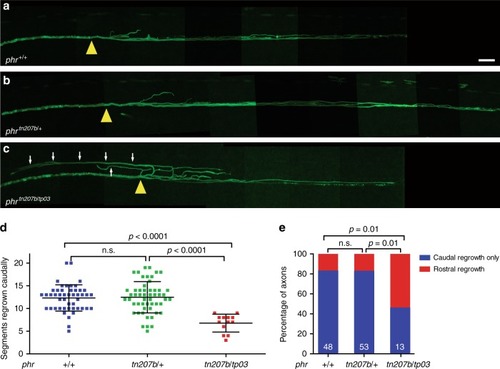
Mutation in PHENOTYPE:
|
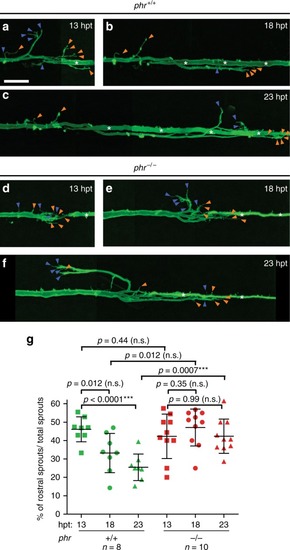
PHR is required to destabilize misdirected sprouts. Time-lapse imaging over 10 h of regrowing Mauthner axons in wild-type larvae and PHENOTYPE:
|
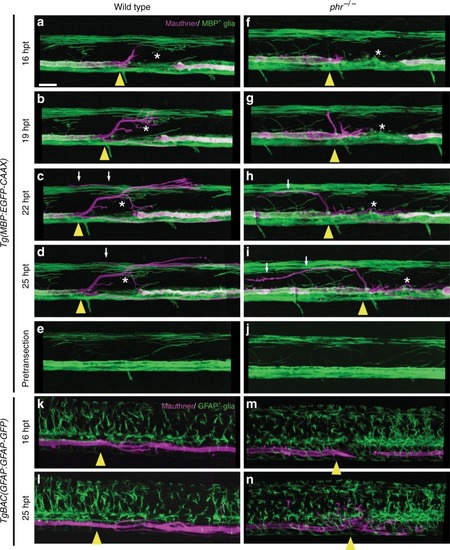
PHR does not control the morphology of MBP- and GFAP-positive glial cells. Time-lapse imaging over 9 h of regrowing Mauthner axons labeled by |
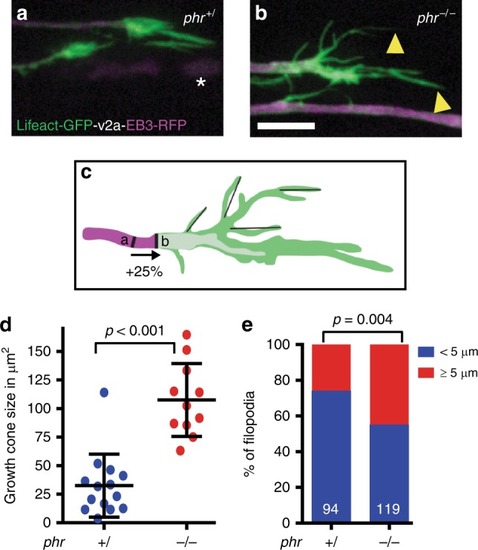
PHR controls growth cone size and filopodia length. |
PHENOTYPE:
|