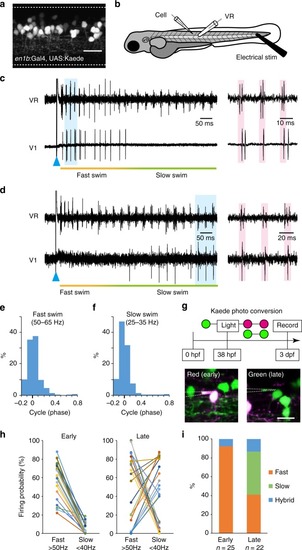
Firing patterns of V1 neurons in larval zebrafish. a A side view of the compound transgenic fish of Tg[en1b:Gal4] and Tg[UAS:Kaede]. The dashed lines indicate boundaries of the spinal cord. Scale bar, 20 μm. b A schematic illustration of the simultaneous recordings of a V1 neuron (loose-patch) and ventral root (VR). Fictive swimming was elicited by applying brief electrical stimulation near the tail. c An example of the recordings from the fast-type V1 neurons. The blue arrowhead shows the time point of electrical stimulation. In the right panel, the region shadowed in blue in the left panel is enlarged. d An example of the recordings from the slow-type V1 neurons. e Histogram of spike timings of fast-type V1 neurons during fast (50–65 Hz) swim (1387 swimming cycles from 29 cells). f Histogram of spike timings of slow-type V1 neurons during slow (25–35 Hz) swim (5782 swimming cycles from 10 cells). g Schematic diagram of the Kaede photo-conversion experiment (top). The bottom two panels show the recordings from early-born V1 neurons (red Kaede [shown in magenta], left) and late-born V1 neurons (green Kaede, right). Scale bar, 10 μm. h Firing probability of early-born V1 neurons (left, n = 25) and late-born V1 neurons (right, n = 22) in each cycle during fast (>50 Hz) and slow (<40 Hz) swim. Each colored circle represents each recorded cell. i Classification of the recorded V1 neurons. Out of the 25 early-born V1 neurons, n = 23 for fast-type and n = 2 for hybrid-type. Out of the 22 late-born V1 neurons, n = 9 for fast-type, n = 10 for slow-type, and n = 3 for hybrid-type. If the value of the firing probability during fast swim was more than double that during slow swim, the cell was considered a fast-type (and vice versa). If the difference was within the doubled value, the cell was considered a hybrid-type

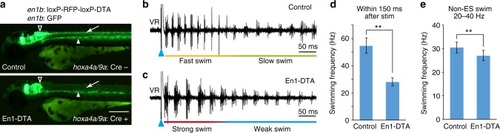
V1 ablation reduced cycle frequency in swimming. a Fluorescent images (green channel) of Tg[en1b:GFP] and Tg[en1b:loxP-RFP-loxP-DTA] fish with (bottom panel) or without (top panel) Tg[hoxa4a/9a:Cre]. Green fluorescent protein (GFP) expression in the spinal V1 neurons (arrow) is absent in the presence of Cre (En1-DTA), with GFP expression in the brain (triangle) and slow muscle cells in the middle region of the body (arrowhead) being intact. Scale bar, 250 μm. b, c Ventral root recordings of fictive swimming elicited by electrical stimulations (ESs) in a control (b) and an En1-DTA fish (c). d Swimming frequency of control and En1-DTA fish during the initial phase of ES swim (swimming elicited by electrical stimulation). Control: 54.8 ± 5.7 Hz, number of fish = 73. En1-DTA: 28.0 ± 2.9 Hz, n = 57. **P < 0.01 (two-tailed t test, P = 6.4 × 10−62). e Swimming frequency of control and En1-DTA fish during Non-ES swim. Swim cycles with frequencies within 20–40 Hz were picked up and averaged. Control: 30.5 ± 2.3 Hz, n = 73. En1-DTA: 27.1 ± 2.2 Hz, n = 57. **P < 0.01 (two-tailed t test, P = 2.6 × 10−14). Data are mean ± s.d.

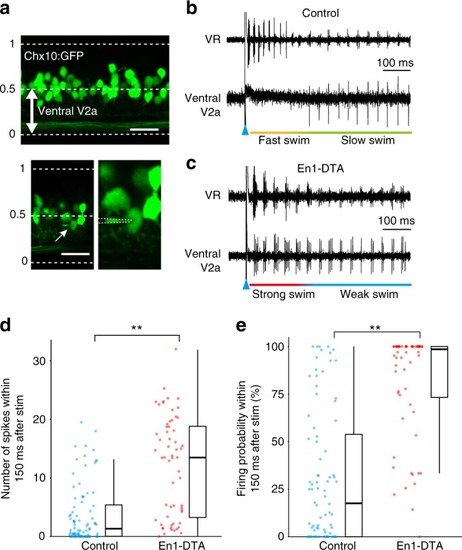
Activity of ventrally located V2a neurons in control and En1-DTA fish. a Lateral view of the spinal cord of Tg[chx10:GFP]. The horizontal dashed lines indicate the dorsal and ventral boundaries of the spinal cord. Ventrally located V2a neurons (the position from 0 to 0.5) are the subjects of the recordings (top panel). The bottom two panels show the images of a loose-patch recording. Scale bar, 20 μm. b An example of simultaneous recordings between ventrally located V2a neurons (loose-patch) and ventral root (VR) in control fish. c An example of simultaneous recordings between ventrally located V2a neurons (loose-patch) and VR in En1-DTA fish. d, e Numbers of spikes (d) and firing probability in each cycle (e) during fast/strong swim. Each circle represents each cell (n = 84 for ventrally located V2a neurons in control; n = 60 for ventrally located V2a neurons in En1-DTA). **P < 0.01 (Mann–Whitney U test, P = 1.3 × 10−10 [d], P = 3.7 × 10−14 [e]). Boxes represent the interquartile range (IQR) between first and third quartiles and the line inside represents the median. Whiskers denote the lowest and highest values within 1.5 × IQR from the first and third quartiles, respectively

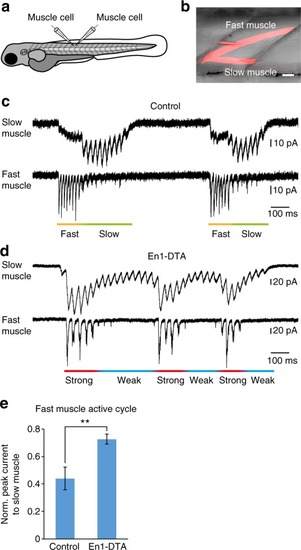
Voltage-clamp recordings of fast and slow muscles in control and En1-DTA fish. a A schematic illustration of the simultaneous voltage-clamp recordings of two muscle cells (one for a fast muscle, the other for a slow muscle). Neuro-muscular transmission was partially blocked in these experiments, and portions of synaptic currents remained in the recording conditions. b An image after a recording. Slow and fast muscles were morphologically distinct and could be easily distinguished. Scale bar, 20 μm. c Example of simultaneous voltage-clamp recordings in control fish. d Example of simultaneous voltage-clamp recordings in En1-DTA fish. e Normalized currents in the slow muscle cells in the cycle when the fast muscle received strong inputs (>50% of the maximum). Five paired recordings were performed. Control: 0.44 ± 0.08, En1-DTA: 0.73 ± 0.04. Data are mean ± s.d. **P < 0.01 (two-tailed t test, P = 0.00091)

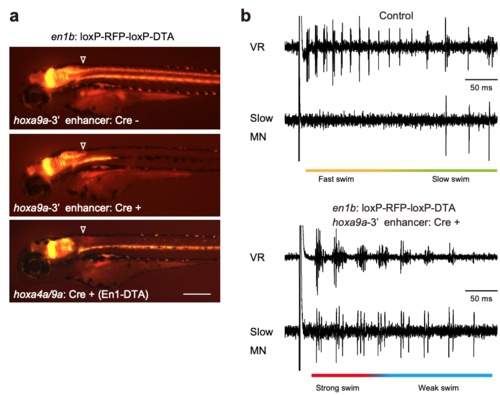
Phenotype of the compound transgenic fish of Tg [en1b:loxP-RFP-loxP-DTA] and Tg[hoxa9a-3'enhancer:Cre] (related to Figures 2 and 3) a, Fluorescent images of Tg[en1b:loxP-RFP-loxP-DTA] fish without a Cre driver (top panel), with Tg [hoxa9a-3'enhancer:Cre] (middle panel), and Tg[hoxa4a/9a:Cre] (bottom panel). Arrowheads indicate the boundary between the hindbrain and the spinal cord. Scale bar, 250 μm. b, VR and slow-type MN recordings during fictive swimming elicited by electrical stimulation in a control (top panel) and a compound transgenic fish of Tg[en1b:loxP-RFP-loxP-DTA] and Tg[hoxa9a-3'enhancer:Cre] (bottom panel).

Acknowledgments
This image is the copyrighted work of the attributed author or publisher, and ZFIN has permission only to display this image to its users. Additional permissions should be obtained from the applicable author or publisher of the image. Full text @ Nat. Commun.