
- Title
-
An Ectoderm-Derived Myeloid-like Cell Population Functions as Antigen Transporters for Langerhans Cells in Zebrafish Epidermis
- Authors
- Lin, X., Zhou, Q., Zhao, C., Lin, G., Xu, J., Wen, Z.
- Source
- Full text @ Dev. Cell
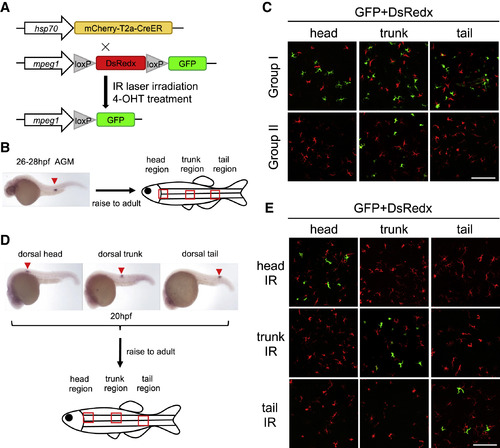
Zebrafish Epidermis Consists of Two Distinct mpeg1+ Cell Populations (A) A schematic diagram of IR-LEGO labeling system using infrared and double transgenic line Tg(hsp70:mCherry-T2a-CreERT2;mpeg1:loxP-DsRedx-loxP-GFP). The hsp70 promoter-directed CreER expression is activated in a small region by infrared (IR) laser. After 4-OHT treatment, DsRedx is removed, resulting in GFP expression in macrophage progenies. (B) A schematic diagram shows the labeling region (expression of CreERT2 mRNA) by 200 MW 1,345 nm infrared laser at 26–28 hpf and the imaging regions (red square) in adult epidermis. (C) Epidermal GPF+ cells (labeled) and DsRedx+ cells (unlabeled) in the head, trunk, and tail regions in group I (n = 12) and group II (n = 8) adult fish. Scale bar, 100 μm. (D) In situ hybridization of CreERT2 mRNA expression indicates the labeling positions of non-hematopoietic regions (dorsal head, trunk, and tail) in 20 hpf embryos, and red squares represent the imaging regions. (E) Epidermal GFP+ cells (labeled) and DsRedx+ cells (unlabeled) in the head, trunk, and tail regions of the adult fish that were irradiated in the dorsal head, trunk, and tail regions at 20 hpf. Scale bar, 100 μm. |
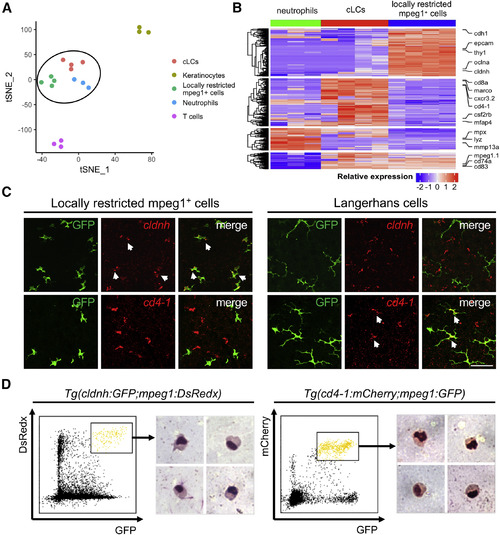
Locally Restricted mpeg1+ Cells Are Highly Similar to cLCs in Transcriptome and Cellular Morphology (A) t-SNE analysis of five different cell populations isolated from the epidermis of adult fish: locally restricted mpeg1+ cells (n = 4), cLCs (n = 4), neutrophils (n = 3), keratinocytes (n = 3), and T cells (n = 3). Locally restricted mpeg1+ cells cluster together with cLCs and neutrophils. (B) Heatmap shows relative expression of a total of 613 differentially expressed genes (|log2FC| > 1, FDR < 0.05) among neutrophils, cLCs, and locally restricted mpeg1+ cells. Representative genes are indicated at the right. (C) In situ hybridization of cldnh (red) and cd4-1 (red) in irradiated scales, followed by anti-GFP staining of locally restricted mpeg1+ cells (green) and cLCs (green). White arrows indicate co-localization of cldnh with locally restricted mpeg1+ cells, and cd4-1 with cLCs. Scale bar, 50 μm. (D) Geimsa staining of locally restricted mpeg1+ cells and cLCs sorted from the epidermis of adult Tg(cldnh:GFP;mpeg1:DsRedx) fish (n = 3) and Tg(cd4-1:mCherry;mpeg1:GFP) fish (n = 3). |
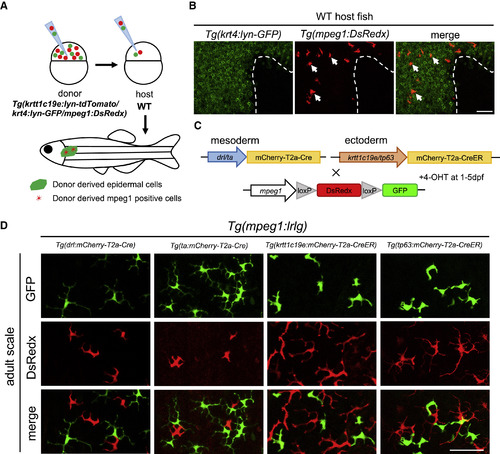
MLCs Are Derived from Ectodermal Origin (A) A schematic draw of cell transplantation assay. About 30 cells from Tg(krtt1c19e:lyn-tdTomato;krt4:lyn-GFP;mpeg1:DsRedx) donor embryos are collected at 3.5 hpf and transplanted into WT embryos at the same stage. Chimeric embryos with successful contribution of donor cells to ectodermal cells (tdTomato+) are grown to 2 months old and subjected to correlation analysis for donor-derived mpeg1+ cells (DsRedx+) and keratinocytes in the epidermis (lyn-GFP+). (B) Donor mpeg1+ (red) (representing MLCs) and krt4+ cells (green) co-exist in the epidermis of 2-month-old recipients (n = 11). White dash line indicates the mosaic boundary. Scale bar, 50 μm. (C) A schematic diagram shows the strategy to track mesoderm- and ectoderm-derived mpeg1+ cells in the epidermis of adult fish. Mesoderm-specific Cre lines Tg(drl/ta:mCherry-T2a-Cre) and ectoderm-specific CreER lines Tg(krtt1c19e/tp63:mCherry-T2a-CreERT2) are outcrossed with Tg(mpeg1:loxP-DsRedx-loxP-GFP) reporter line. The resulting ectoderm-specific CreER-reporter double transgenic lines are then treated with 4-OHT at 1 dpf for 4 days. (D) Confocal images of adult scale epidermis from four groups of fate-mapping double transgenic fish. Both mesoderm-specific (representing cLCs) and ectoderm-specific (representing MLCs) double transgenic fish contain GFP+ cells (each group, n = 10 fish). Scale bar, 50 μm. |
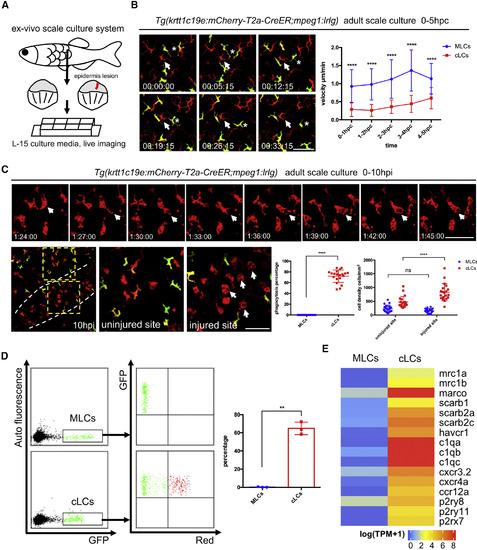
MLCs Have High Mobility but Do Not Respond to Tissue Injury or Bacteria Challenge (A) A diagram of experimental procedure of ex vivo scale culture in normal and injured condition. Scales isolated from adult fish are immediately placed in L-15 culture media with 10% FBS and 1% antibiotics and subjected to time-lapse imaging. Red line indicates epidermal injury. (B) Time-lapse imaging of normal scales from 4-OHT-treated Tg(krtt1c19e:mCherry-T2a-CreERT2;mpeg1:loxP-DsRedx-loxP-GFP) fish. The positions (left panel) of a cLC (DsRedx+) and a MLC (GFP+) at different time points within a 30-min imaging period are indicated by white arrows and white stars, respectively. Scale bar, 50 μm. Quantification data (right panel) show the average velocities of MLCs (blue, n = 30 cells from 6 scales) and cLCs (red, n = 30 cells from 6 scales) during the first 5 h post culture (hpc). (C) Time-lapse imaging of the injured scales from 4-OHT-treated Tg(krtt1c19e:mCherry-T2a-CreERT2;mpeg1:loxP-DsRedx-loxP-GFP) fish. Upper panels show that cLCs (DsRedx+) undergo actively phagocytosis(indicated by the appearance of large vacuoles) in injured site. Scale bar, 50 μm. Lower panels show the accumulation of cLCs (DsRedx+) in injured site at 10 h post injury (the end of time-lapse imaging). White dash lines (left panel) show injured boundary, yellow dash boxes (left panel) indicate enlarged uninjured and injured sites, and white arrows (in the right panel) indicate the cLCs with big vacuoles. Scale bar, 50 μm. Quantification data show phagocytosis ratio of MLCs (blue) and cLCs (red) during time-lapse imaging (1–10 hpi) and cell densities of MLCs (blue) and cLCs (red) at the end of time-lapse imaging (10 hpi) at normal and injured sites (n = 20 scales). (D) FACS analysis of MLCs (GFP+) from Tg(krtt1c19e:mCherry-T2a-CreERT2;mpeg1:loxP-mIFP-loxP-GFP) and cLCs (GFP+) from Tg(drl:mCherry-T2a-Cre;mpeg1:loxP-mIFP-loxP-GFP) incubated with pHrodo Red E. coli. Red+ E. coli are detected in cLCs but not in MLCs. Quantification data (right panel) shows the percentage of the MLCs and cLCs positive for Red+ E. coli. (each group, n = 3 fish). (E) Normalized average gene expression levels [log(TPM+1)] of the well-known chemokine receptors, nucleotide receptors, and scavenger receptors in MLCs and cLCs from RNA-seq data (n = 4). Data are represented as mean ± SD, ∗∗p < 0.01, ∗∗∗∗p < 0.0001. See also Figure S5. |
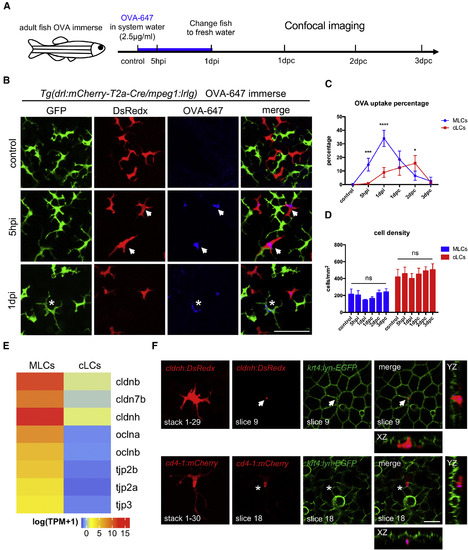
MLCs Sample Soluble Antigens from External Environment through Transepithelial Protrusions (A) A schematic diagram of experimental procedure of OVA-647 treatment of adult zebrafish. Whole fish are immersed in 2.5 μg/mL OVA-647 for 24 h (1 dpi) and then transferred to fresh system water without antigens for post-chase (pc) analysis. Images are captured at 5 h post immersion (hpi), 1 day post immersion (1 dpi), and 1 day post-chase (dpc), 2 dpc, and 3 dpc. (B) Confocal images of the epidermis of Tg(drl:mCherry-T2a-Cre;mpeg1:loxP-DsRedx-loxP-GFP) fish before (control), during (5 hpi), and after (1 dpi) OVA-647 immersion. Green, red, and blue signals represent cLCs, MLCs, and OVA-647, respectively. White arrows indicate OVA-647 in MLCs at 5 hpi, and white stars indicate OVA-647 in cLCs at 1 dpi. Scale bar, 50 μm. (C) Quantification of the percentages of OVA-647 uptake in MLCs (blue) and cLCs (red) at different time points (n = 4 fish). (D) Quantification of cell densities of MLCs (blue) and cLCs (red) at different time points (n = 4 fish). (E) Normalized average expression levels of tight junction genes [log(TPM+1)] in MLCs and cLCs from RNA-seq data (n = 4). (F) Confocal images of the epidermis in Tg(cldnh:DsRedx;krt4:lyn-GFP)and Tg(cd4-1:mCherry;krt4:lyn-GFP) fish after OVA-647 immersion. Upper panels show a typical transepithelial protrusion (white arrows) formed by MLCs (DsRedx+), which penetrates through the junction of keratinocytes and reaches the surface of krt4+ keratinocyte layer in XZ and YZ section views. Lower panels show normal protrusions (white star) formed by cLCs (mCherry+), which remain underneath krt4+keratinocyte layer. Scale bar, 10 μm. Data are represented as mean ± SD, ∗p < 0.05, ∗∗∗p < 0.001, ∗∗∗∗p < 0.0001. |
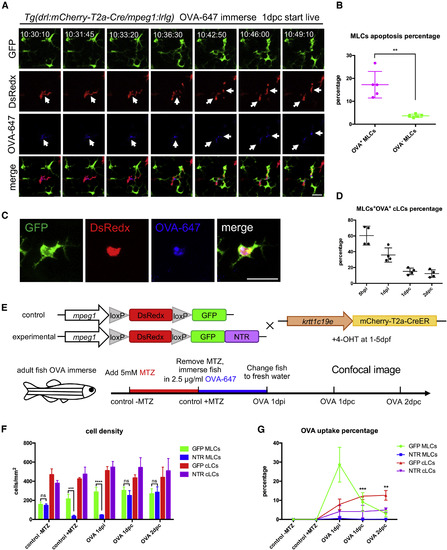
MLCs Transfer Soluble Antigens to cLCs through Apoptosis-Phagocytosis Axis (A) Time-lapse imaging on the scales of the OVA-647-treated Tg(drl:mCherry-T2a-Cre;mpeg1:loxP-DsRedx-loxP-GFP) fish. The time-lapse begins at 1 dpc and images for 12 h. White arrows indicate that an apoptotic OVA-647+ (blue) MLC (red), which is subsequently phagocytized by three nearby cLCs (green). Scale bar, 20 μm. (B) Quantification data show the percentages of apoptotic OVA-647+ and OVA-647- MLCs in the same scales during time-lapse imaging (n = 5 fish). (C) Images indicate a typical cLCs (green) with OVA-647 (blue) and MLCs debris (red) inside in a living Tg(drl:mCherry-T2a-Cre;mpeg1:loxP-DsRedx-loxP-GFP) fish after OVA-647 treatment. Scale bar, 25 μm. (D) Quantification data show the percentages of cLCs containing OVA-647 and MLC debris inside to total OVA-647+ cLCs at different time points (n = 4 fish). (E) A schematic diagram shows the experimental procedure of MLC-depletion strategy using the NTR-MTZ system. Control Tg(krtt1c19e:mCherry-T2a-CreERT2;mpeg1:loxP-DsRedx-loxP-GFP) and experimental Tg(krtt1c19e:mCherry-T2a-CreERT2;mpeg1:loxP-DsRedx-loxP-GFP-NTR) fish (both are treated with 4-OHT for 5 days during early stage) are immersed in 5 mM MTZ for 24 h transferred to system water containing 2.5 μg/mL OVA-647 for another 24 h (OVA 1 dpi), and finally switched to fresh system water. (F) Quantification data show cell densities of MLCs and cLCs in control (GFP MLCs; GFP cLCs) and experimental fish (NTR MLCs; NTR cLCs) at different time points (each group, n = 4 fish). (G) Quantification of the percentages of OVA-647+ MLCs and cLCs in control (GFP MLCs; GFP cLCs) and experimental fish (NTR MLCs; NTR cLCs) (each group, n = 4 fish). Data are represented as mean ± SD, ∗∗p < 0.01, ∗∗∗p < 0.001, ∗∗∗∗p < 0.0001. |
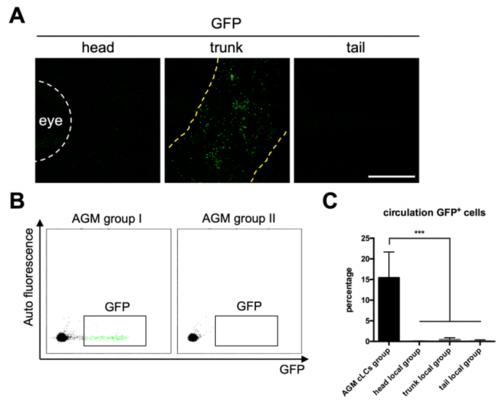
Fish with locally restricted mpeg1+ cells lack GFP+ cells in circulation. Related to Figure 1 (A) Low magnification images show the distribution of locally restricted mpeg1+ cells in group II fish. Yellow dash lines indicate the boundary of GFP+ cells. Scale bar, 1 mm. (B) FACS analysis indicates that GFP+ cells are present in the circulation of group I fish with universally distributed mpeg1+ cells but not in group II fish with locally restricted mpeg1+ cells. (C) The percentage of GFP+ cells in total circulating mpeg1+ cells in AGMirradiated group I adult fish (n=4), dorsal head region-irradiated adult fish (n=4), dorsal trunk region-irradiated adult fish (n=4) and dorsal tail region-irradiated adult fish (n=4). Data are represented as mean ± SD, ***P<0.001. |
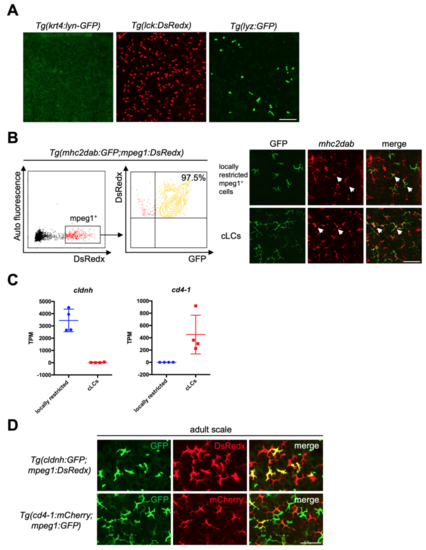
RNA-seq reveals common and unique cell markers for locally restricted mpeg1+ cells and cLCs. Related to Figure 2 (A) Transgenic lines Tg(krt4:lyn-GFP), Tg(lck:DsRedx) and Tg(lyz:GFP) specifically mark keratinocytes, T cells and neutrophils in epidermis respectively. Scale bar, 50μm. (B) Flow cytometry (left) shows 97.5% mpeg1+ cells in epidermis are positive for mhc2dab in Tg(mhc2dab:GFP;mpeg1:DsRedx) fish (n=3). In-situ hybridization of mhc2dab (red) and anti-GFP staining (green) indicate that both locally restricted mpeg1+ cells (green) and cLCs (green) express mhc2dab. White arrows indicate mhc2dab+GFP+ cells. (C) TPM values of cldnh and cd4-1 in locally restricted mpeg1+ cells (blue) and cLCs (red) from four independent RNA-seq data. Each data contains cells isolated from 3 fish. (D) Locally restricted mpeg1+ cells (GFP+DsRedx+, yellow) and cLCs (mCherry+GFP+, yellow) are specifically marked in the epidermis of adult Tg(cldnh:GFP;mpeg1:DsRedx) and Tg(cd4-1:mCherry;mpeg1:GFP) fish respectively (each group, n=8 fish). Scale bar, 50μm. |
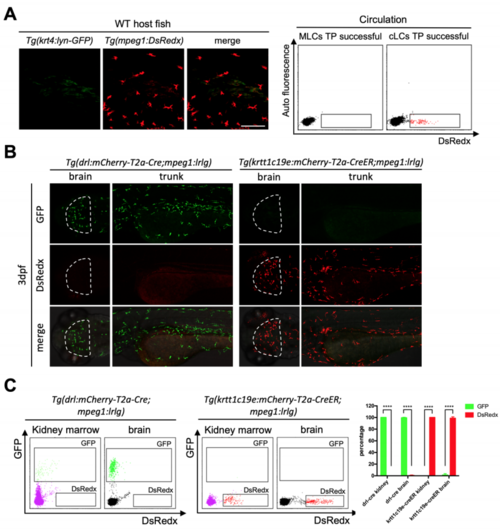
Tg(drl:mCherry-T2a-Cre) and Tg(krtt1c19e:mCherry-T2aCreERT2) fish specifically and efficiently label mesoderm derived blood cells and ectoderm derived cells respectively. Related to Figure 3 (A) Successful transplantation of cLCs in 2 months old recipients (n=5). Donor mpeg1+ cells (red) (representing cLCs) widely distribute throughout whole fish epidermis while no krt4+ cells (green) exist. Scale bar, 100μm. FACS data show that only cLCs successful transplanted fish contain DsRedx+ cells in circulation. (B) Confocal images of brain (white dash lines) and trunk region of Tg(drl:mCherry-T2a-Cre;mpeg1:loxP-DsRedx-loxP-GFP) and Tg(krtt1c19e:mCherry-T2a-CreERT2;mpeg1:loxP-DsRedx-loxP-GFP) (add 4- OHT 1-5dpf) fish at 3dpf (each group, n=8 fish). All microglia and trunk macrophage are labeled by mesodermal line while no cells could be labeled by ectodermal line. Scale bar, 200μm. (C) FACS analysis of kidney marrow and brain mpeg1+ cells in adult fish. Nearly 100% mpeg1+ cells in Tg(drl:mCherry-T2a-Cre;mpeg1:loxP-DsRedx-loxP-GFP) fish are GFP+, while no cells in Tg(krtt1c19e:mCherry-T2aCreERT2;mpeg1:loxP-DsRedx-loxP-GFP) (add 4-OHT 1-5dpf) fish are GFP+. Quantification of GFP+ and DsRedx+ cells percentages to total mpeg1+ population in kidney marrow and brain (each group, n=4). Data are represented as mean ± SD, ****P<0.0001. |
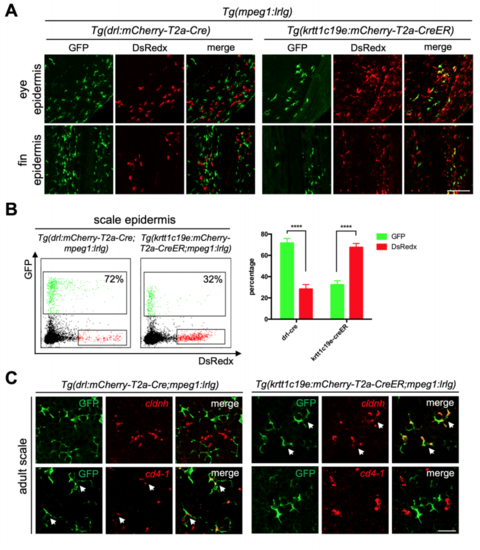
Ectodermal derived mpeg1+ populations only existed in epidermis. Related to Figure 3 (A) Confocal images of epidermis covered eyes and fins. GFP+ cells are cLCs and DsRedx+ cells are MLCs in Tg(drl:mCherry-T2a-Cre;mpeg1:loxP-DsRedxloxP-GFP). In Tg(krtt1c19e:mCherry-T2a-CreERT2;mpeg1:loxP-DsRedx-loxPGFP) fish (add 4-OHT at 1-5dpf), GFP+ cells are MLCs while DsRedx+ cells are cLCs. Scale bar, 100μm. (B) FACS analysis of mpeg1+ macrophage populations in scale epidermis. In Tg(drl:mCherry-T2a-Cre;mpeg1:loxP-DsRedx-loxP-GFP) fish, about 72% of total mpeg1+ cells are GFP+, while in Tg(krtt1c19e:mCherry-T2aCreERT2;mpeg1:loxP-DsRedx-loxP-GFP) (add 4-OHT at 1-5dpf) fish, only 32% of total mpeg1+ cells are GFP+. Quantification of GFP+ and DsRedx+ cells percentages to total mpeg1+ population in scale epidermis (each group, n=4). (C) In-situ hybridization of cldnh (red) and cd4-1 (red) in scales from Tg(krtt1c19e:mCherry-T2a-CreERT2;mpeg1:loxP-DsRedx-loxP-GFP) and Tg(drl:mCherry-T2a-Cre;mpeg1:loxP-DsRedx-loxP-GFP) fish, followed by antiGFP staining. White arrows indicate co-localization of cldnh, cd4-1 with GFP+ cells. Scale bar, 25μm. Data are represented as mean ± SD, ****P<0.0001. |
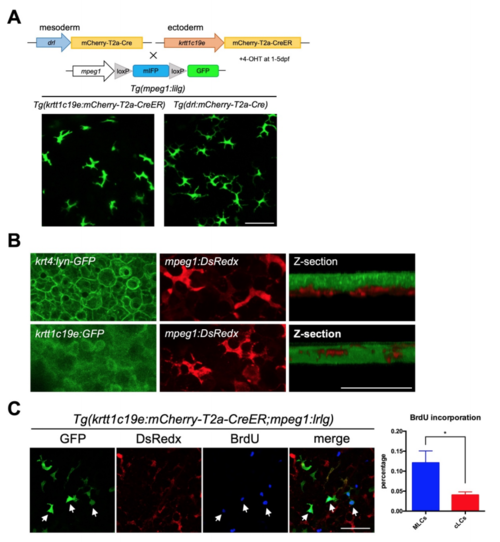
All mpeg1+ cells reside beneath the superficial krt4+ keratinocyte layer. Related to Figure 4, Figure 5 and Figure 6 (A) Generation double transgenic lines by crossing Tg(mpeg1:loxP-mIFP-loxPGFP) with Tg(krtt1c19e:mCherry-T2a-CreERT2) and Tg(drl:mCherry-T2a-Cre) fish. In these double transgenic lines, MLCs and cLCs are marked by GFP (lower panels). Scale bar, 50μm. (B) Confocal images of the epidermis of adult Tg(krt4:lyn-GFP;mpeg1:DsRedx) and Tg(krtt1c19e:GFP;mpeg1:DsRedx) fish. Z-section show that mpeg1+ cells (red) reside within krtt1c19e+ cells layer (green), which is beneath the krt4+ cells layer (green). Scale bar, 50μm. (C) Confocal images of Tg(krtt1c19e:mCherry-T2a-CreERT2;mpeg1:loxPDsRedx-loxP-GFP) fish, which were intraperitoneally injected BrdU at 1 day post OVA immersion (1dpi), then fixed at 2 day after injection (2dpc). White arrows indicate the incorporation of BrdU (blue) with MLCs (green). Quantification of BrdU incorporation percentages of MLCs and cLCs (n=3 fish). Scale bar, 50μm. Data are represented as mean ± SD, *P<0.05. |
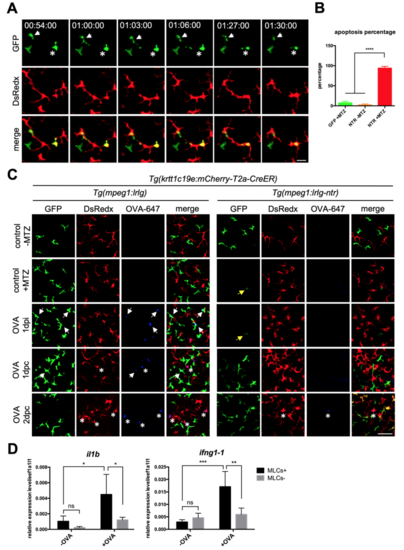
Depletion of MLCs impairs antigen uptake of cLCs. Related to Figure 6 (A) Live imaging on the scales of Tg(krtt1c19e:mCherry-T2aCreERT2;mpeg1:loxP-DsRedx-loxP-GFP-NTR) fish in L-15 culture media with 5 mM MTZ. White arrows and stars indicate two GFP-NTR+ MLCs undergo apoptosis and the dying cells are then phagocytized by DsRedx+ cLCs. Scale bar, 20μm. (B) Quantification of the percentages of apoptotic GFP+ MLCs in control Tg(krtt1c19e:mCherry-T2a-CreERT2;mpeg1:loxP-DsRedx-loxP-GFP) fish and experimental Tg(krtt1c19e:mCherry-T2a-CreERT2;mpeg1:loxP-DsRedx-loxPGFP-NTR) fish with or without 5 mM MTZ treatment (each group, n=4 fish). (C) Confocal images of the epidermis of control Tg(krtt1c19e:mCherry-T2aCreERT2;mpeg1:loxP-DsRedx-loxP-GFP) and experimental Tg(krtt1c19e:mCherry-T2a-CreERT2;mpeg1:loxP-DsRedx-loxP-GFP-NTR) fish (each group, n=4) after MTZ and OVA-647 treatments. Yellow arrows indicate few remaining MLCs in experimental fish after MTZ treatment. White arrows and stars show the colocalization of OVA-647 (blue) with MLCs (green) and cLCs (red) respectively. After depletion of MLCs (green), OVA-647 (blue) signals are significantly reduced in cLCs (red). Scale bar, 50μm. (D) Relative expression of il1b and ifng1-1 in whole fish epidermis at 2 dpc. In control fish (MLCs+, n=4), OVA-647 treatment induces significant increases of il1b and ifng1-1 expressions (black bar), whereas OVA-647-induced il1b and ifng1-1 expressions are dramatically reduced in the MLCs depleted fish (MLCs-, n=4) (grey bar). Data are represented as mean ± SD, *P<0.05, **P<0.01, ***P<0.001, ****P<0.0001. |
Reprinted from Developmental Cell, 49(4), Lin, X., Zhou, Q., Zhao, C., Lin, G., Xu, J., Wen, Z., An Ectoderm-Derived Myeloid-like Cell Population Functions as Antigen Transporters for Langerhans Cells in Zebrafish Epidermis, 605-617.e5, Copyright (2019) with permission from Elsevier. Full text @ Dev. Cell