
- Title
-
Cerebrovascular Injuries Induce Lymphatic Invasion into Brain Parenchyma to Guide Vascular Regeneration in Zebrafish
- Authors
- Chen, J., He, J., Ni, R., Yang, Q., Zhang, Y., Luo, L.
- Source
- Full text @ Dev. Cell
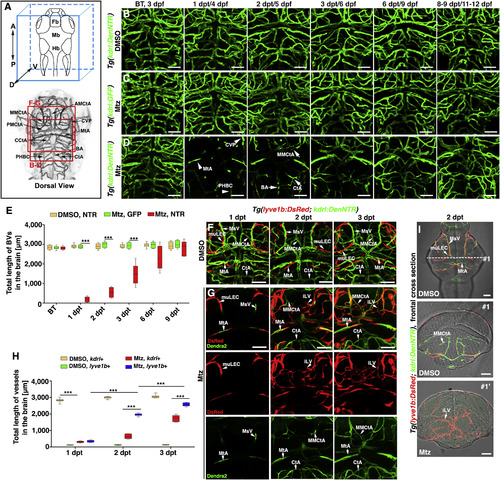
Lymphatic Vessels Appear in the Brain Parenchyma after Cerebrovascular Injury (A) Brain vascular anatomy of zebrafish at 3 dpf. Red frames indicate the image areas of corresponding panels. Dorsal view, anterior upward. (B–E) Zebrafish NTR-Mtz cerebrovascular regeneration model. In contrast to the Tg(kdrl:DenNTR) larvae treated with DMSO (B) (n = 40/40) and Tg(kdrl:GFP) larvae treated with Mtz (C) (n = 49/49), brain vasculature of the Tg(kdrl:DenNTR) larvae were specifically injured after incubation with 1 mM Mtz (D) (1 dpt, n = 39/39). A time course of regeneration from BT to 8–9 dpt is shown. The speed of the neoangiogenesis is presented as the total length of the blood vessels (E) (n = 10). Two-way ANOVA by Dunnett’s multiple comparisons test. All p < 0.0001). Arrowheads indicate the remaining relatively large vessels CVP, MtA, and PHBC. Arrows indicate the emerging nascent blood vessels MMCtA, BA, and CtA. ∗∗∗p < 0.001. Data are represented as mean ± SEM. Scale bar, 50 μm. See also Figures S1 and S5. (F–H) In the control, the lyve1b+ LECs were absent in the brain parenchyma, only present on the optic tectum (F) (n = 24/24) from 1 to 3 dpt. After Mtz treatment (G) (n = 20/24), the growth of the lyve1b+ lymphatics was rapid and active at 2 dpt but apparently slowed at 3 dpt. The quantifications show the total length of kdrl+ and lyve1b+ vessels in the brain at 1–3 dpt (H) (n = 10). Two-way ANOVA by Dunnett’s multiple comparisons test. All p < 0.0001). ∗∗∗p<0.001. Data are represented as mean ± SEM. Scale bar, 50 μm. See also Figure S2. (I) In frontal cross sections, the lyve1b+ lymphatics were predominantly localized in the meninges at the brain surface in the control larvae (#1) (n = 6/6), whereas became abundant in the brain parenchyma at 2 dpt after Mtz treatment (#1′) (n = 6/6). Scale bar, 50 μm. See also Figure S2. AMCtA, anterior (rostral) mesencephalic central artery; BA, basilar artery; CCtA, cerebellar central artery; CtA, central artery; CVP, choroidal vascular plexus; Fb, forebrain; Hb, hindbrain; iLVs, ingrown lymphatic vessels; Mb, midbrain; MMCtA, middle mesencephalic central artery; MsV, mesencephalic vein; MtA, metencephalic artery; muLECs, meningeal mural lymphatic endothelial cells; PHBC, primordial hindbrain channel; PMCtA, posterior (caudal) mesencephalic central artery. |

Meningeal Lymphatics Rapidly Grow into the Injured Parenchyma in Response to Cerebrovascular Damage (A and B) Time-lapse imaging showed the growth of meningeal lymphatics into the injured area (A) (n = 10/10). Images at the early phases after Mtz treatment showed the initiation of ingrowth and branching of meningeal lymphatics by 3D reconstruction (B) (n = 10/10). The elapsed time is indicated in h:min after 0 dpt. Blue and purple frames indicate the image areas of corresponding panels. See also Videos S1 and S2. (C–G) The ingrown vessels originate from lyve1b+ cells. Transgenic lines, time points of Mtz and 4-OHT administrations were shown in (C). Negatively controlled by Mtz plus ethanol (D) (n = 12/12) and positively controlled by DMSO plus 4-OHT (E) (n = 19/21), the ingrown vessels were double positive for anti-DsRed and anti-GFP antibodies if Mtz plus 4-OHT were applied (F) (n = 21/24). The statistics show the ratios of the lyve1b:DsRed-labeled vessels positive for GFP (G) (n = 10). Two-tailed unpaired t test, p < 0.0001. ∗∗∗p < 0.001. Data are represented as mean ± SEM. Scale bar, 50 μm. (H and I) In contrast to DMSO treatment (H) (n = 10/10), photoconversion of muLECs at BT followed by Mtz treatment resulted in retention of Kaede-red fluorescence in the ingrown vessels at 2 dpt (I) (n = 12/12). BT, before treatment. Scale bar, 50 μm. All images are dorsal view, anterior upward. AceV, anterior (rostral) cerebral vein; BA, basilar artery; CtA, central artery; iLVs, ingrown lymphatic vessels; MsV, mesencephalic vein; MMCtA, middle mesencephalic central artery; MtA, metencephalic artery; muLECs, meningeal mural lymphatic endothelial cells. |
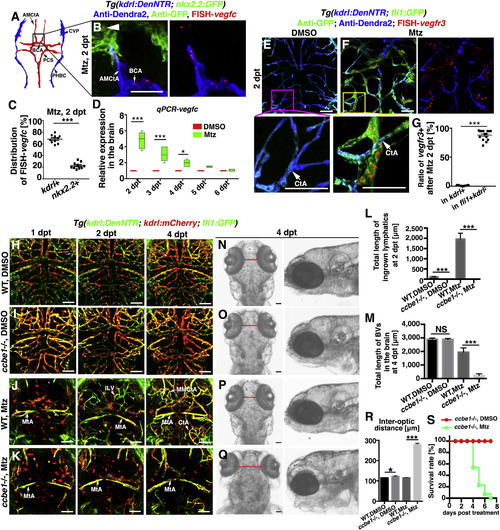
Ingrowth of Meningeal Lymphatics Is Dependent on the Locally Activated Vegfc (A–D) Illustration of brain vascular network in lower middle layer indicates the position of vessels in (B) Expression of vegfc at 2 dpt (B) (n = 30/34). Approximately 68% and 22% of the FISH-vegfc signals are distributed in the BECs and nkx2.2+ neurons (B, arrowhead), respectively (C) (n = 10). Two-tailed unpaired t test, p < 0.0001. RT-qPCRs using dissected brain tissues show the relative expression levels of vegfc in the brain at 2–6 dpt (D) (n = 5). Two-way ANOVA by Dunnett’s multiple comparisons test. DMSO, 2 dpt versus Mtz, 2 dpt, p < 0.0001; DMSO, 3 dpt versus Mtz, 3 dpt, p < 0.0001; DMSO, 4 dpt versus Mtz, 4 dpt, p = 0.0119). Dorsal view, anterior upward. Scale bar, 50 μm. See also Figure S3. (E–G) In contrast to the absence of vegfr3 in the control (E) (n = 18/20), vegfr3 is exclusively expressed in the fli1+kdrl- LECs at 2 dpt (F) (n = 17/22). Higher magnification images of the framed areas (CtAs, arrows) are displayed. The statistics show the ratios of vessels positive for vegfr3 (G) (n = 15). Two-tailed unpaired t test, p < 0.0001. Ventral view, anterior upward. Scale bar, 50 μm. See also Figure S3. (H–M) Brain vascular development was unaffected in the ccbe1 mutant (I) (n = 14/14) in contrast to the wild type (WT) (H) (n = 22/22). After Mtz treatment, meningeal lymphatic ingrowth (fli1+kdrl−) and neoangiogenesis (kdrl+) did not occur in the ccbe1mutant (K) (n = 23/27) in contrast to the wild type (J) (n = 36/40). Red spots in (J) and (K) represents endocytosed kdrl:mCherry red fluorescence by macrophages. The quantifications show the total lengths of the ingrown lymphatics at 2 dpt (L) (n = 60). Two-tailed unpaired t test. All p < 0.0001 and nascent blood vessels (BV) at 4 dpt (M) (n = 6). Two-tailed unpaired t test, WT, DMSO versus ccbe1−/−, DMSO, p = 0.8383; WT, Mtz versus ccbe1−/−, Mtz, p < 0.0001). Dorsal view, anterior upward. Scale bar, 50 μm. (N–S) The absence of ingrown lymphatics causes severe cerebral edema. The bright field images of dorsal and lateral views of zebrafish head at 4 dpt (N–Q). In contrast to the wild type with DMSO treatment (N) (n = 32/32), the ccbe1 mutant exhibited slight cerebral edema (O) (n = 24/24) indicated as the inter-optic distance (red lines). At 4 dpt after Mtz treatment, significantly enlarged inter-optic distance in the ccbe1 mutant (Q) (n = 18/18) indicated severe cerebral edema in contrast to the wild type (P) (n = 18/18), confirmed by statistical analysis (R) (n = 9). Two-tailed unpaired t test, WT, DMSO versus ccbe1−/−, DMSO, p = 0.0209; WT, Mtz versus ccbe1−/−, Mtz, p < 0.0001). The survival rate of ccbe1 mutant from 0 to 8 dpt with and without Mtz treatment (S) (n = 10). Data are represented as mean ± SEM. ∗∗∗p < 0.001, ∗p < 0.05, NS, not significant. Scale bar, 50 μm. AMCtA, anterior (rostral) mesencephalic central artery; BCA, basal communicating artery; CtA, central artery; CVP, choroidal vascular plexus; iLV, ingrown lymphatic vessels; MMCtA, middle mesencephalic central artery; MtA, metencephalic artery; PCS, posterior (caudal) communicating segment; PHBC, primordial hindbrain channel. |
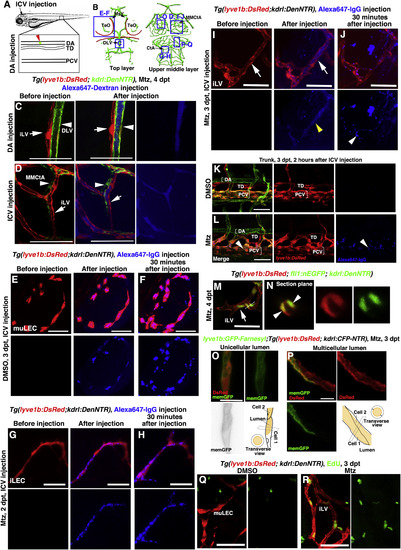
The Ingrown Lymphatics Undergo Lumenization to Drain Brain Interstitial Fluid (A–D) The ingrown meningeal lymphatics become lumenized to drain interstitial fluid. Illustrations of dorsal aorta (DA) and ICV (intracerebroventricular) injection points (A). Blue frames indicate the image areas in the corresponding panels (B). Alexa647-dextran was filled in the blood vessels (arrowheads) but remained absent in the meningeal lymphatics (arrows) after DA injection (C) (n = 9/11). Drainage of Alexa647-labeled interstitial fluid was rapidly observed in the ingrown lymphatic vessels (arrows) after ICV injection (D) (n = 16/18). Note that the lumen of the lymphatic vessel was visible (D, arrows). Dorsal view, anterior upward. Scale bar, 50 μm. (E–L) Endocytosis, but not lumen flow of Alexa647-IgG, was observed in the muLECs of the control larvae after ICV injection at 3 dpt (E) (n = 15/15) and was also observed in the ingrown LECs of the Mtz-treated larvae after ICV injection at 2 dpt (G) (n = 12/13). 30 min later, the endocytosed dye maintained and accumulated in these LECs (F) (n = 14/14; (H) (n = 11/12). If the Alexa647-IgG was injected at 3 dpt after Mtz treatment, the dye filled in the lumen of lymphatic vessels immediately after injection (I) (yellow arrowhead) (n = 17/20). 30 min later, the dye was drained out from the lumen, but the endocytosed dye remained in the ingrown LECs (J,) (arrowheads) (n = 16/20). Comparing to the non-injured larvae (K) (n = 18/18), the dye became apparent in the PCVs of injured larvae at 2 h post-injection (L) (arrowheads) (n = 17/18). Note that the lumen of lymphatics was clearly visible at 3 dpt (I) (arrows) but not in the control (E) or at 2 dpt (G). Dorsal view, anterior upward. Scale bar, 50 μm. (M and N) The nuclei of LECs are labeled by nuclear EGFP transgenes. The section plane in (M) (dash line) is presented in (N). Arrow and arrowheads indicate unicellular and multicellular lumens, respectively. n = 11/12. Dorsal view, anterior upward. Scale bar, 20 μm. (O and P) The plasma membrane of LECs is mosaically labeled by the injection of membrane GFP plasmid. The unicellular lumen is presented by membrane GPF epifluorescence (O) (n = 22/24), whereas the multicellular lumen is exhibited by the mosaicity of a single vessel (P) (n = 22/24), both with schematic illustrations. Scale bar, 10 μm. (Q and R) In contrast to the muLECs in the control (Q) (n = 10/10), many of the ingrown LECs were positive for EdU labeling at 3 dpt (R) (n = 12/12). Ventral view, anterior upward. Scale bar, 20 μm. CtA, central artery; DA, dorsal aorta; DLV, dorsal longitudinal vein; iLVs, ingrown lymphatic vessels; MMCtA, middle mesencephalic central artery; MsV, mesencephalic vein; muLECs, meningeal mural lymphatic endothelial cells; PCV, posterior cardinal vein; TD, thoracic duct; TeO, optic tectum. |
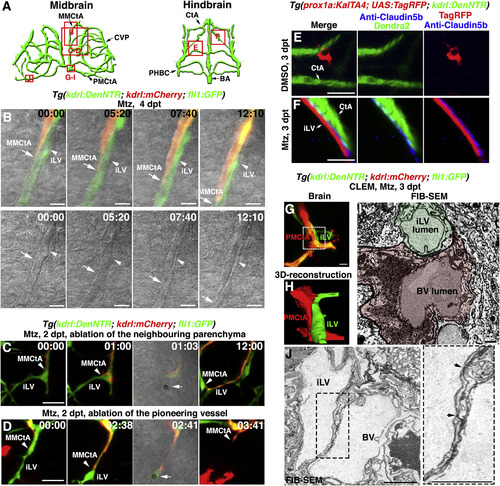
The Ingrown Lymphatics Act as “Growing Tracks” for Nascent Blood Vessels through Direct Physical Adhesion (A) Illustrations of midbrain and hindbrain vascular network indicate the image areas (red boxes) in panels. All panels are dorsal views, anterior upward. (B) Time-lapse imaging showed that the nascent blood vessel (kdrl+, MMCtA, arrows) grew along the preformed lymphatic vessel (fli1+kdrl−, arrowheads). Bright field indicated the two vessel structures. The elapsed time is indicated in h:min. Scale bar, 10 μm. See also Video S3. (C and D) Ablation of the ingrown lymphatic vessel (D) (n = 20/20 vessels in 10 larvae, 2 vessels per larvae) but not the neighboring parenchyma (C) (n = 20/20 sites in 10 larvae, 2 sites per larvae), led to the growth arrest and regression of the adhering nascent blood vessel. Arrowheads indicate the laser irradiation sites. The elapsed time is indicated in h:mins. Scale bar, 20 μm. See also Video S4. (E and F) Triple labeling of anti-Claudin5b antibodies, TagRFP and Dendra2 epifluorescence at 3 dpt. In contrast to DMSO treatment (E) (n = 21/22), Claudin5b was enriched at the interface between the ingrown lymphatic (prox1a+) and nascent blood vessels (kdrl+) after Mtz treatment (F) (n = 18/21). Scale bar, 20 μm. See also Figure S4. (G–J) Correlative light and electron microscopy (CLEM) of brain vessels at 6 dpf/3 dpt. The FIB-SEM target areas inside confocal images (G) are indicated with frames. Scale bar, 10 μm. 3D reconstructions of FIB-SEM single plans identify ingrown meningeal lymphatic vessel (mLV) and nascent blood vessel (BV) as two adhering vessel structures (H) (n = 3/3). The framed area in (G) is shown in (H). Single FIB-SEM image plane indicates the lumens of mLV and BV (I) (n = 3/3). Light green and light red mark the cross sections of the lymphatic vessel and blood vessel, respectively. The dotted frame in (J) indicates the border area of lymphatic and blood vessels, which is enlarged to show tight junctions (J) (arrows). Scale bar, 1 μm. See also Video S5. BA, basilar artery; CtA, central artery; CVP, choroidal vascular plexus; iLV, ingrown lymphatic vessels; MMCtA, middle mesencephalic central artery; PHBC, primordial hindbrain channel; PMCtA, posterior (caudal) mesencephalic central artery. |
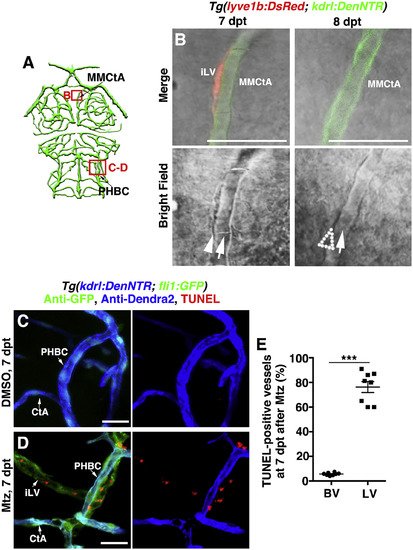
The Ingrown Lymphatic Vessels Undergo Apoptosis after the Completion of Cerebrovascular Regeneration (A) Illustrations of brain vasculature indicate the image areas (red boxes) in panels. All panels are dorsal views, anterior upward. (B) The ingrown lymphatic vessels disappeared from 7 to 8 dpt (n = 23/26). Arrowheadand arrows indicate the adhering lymphatic and blood vessels, respectively. Note the disappearance of the lymphatic vessel at 8 dpt (dotted arrowhead). Scale bar, 20 μm. (C–E) In contrast to the control (C) (n = 33/35), TUNEL signals were detected in approximately 70% of the ingrown lymphatic vessels (fli1+kdrl−) (D) (n = 30/33) but in less than 5% of the blood vessels (kdrl+) (E) (n = 8). Two-tailed unpaired t test (p < 0.0001). Scale bar, 20 μm. Data are represented as Mean ± s.e.m., ∗∗p < 0.001. See also Figure S6. CtA, central artery; iLV, ingrown lymphatic vessels; MMCtA, middle mesencephalic central artery; PHBC, primordial hindbrain channel. |
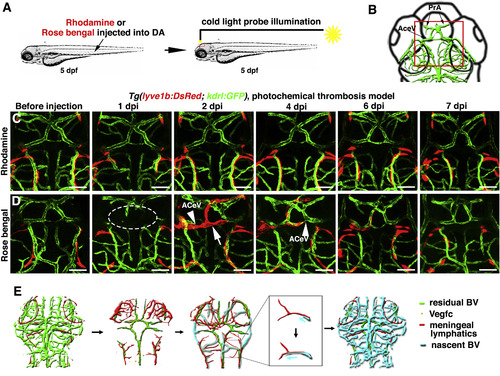
The Temporary Ingrown Lymphatics-Mediated Cerebrovascular Regeneration Is Conserved in the Photochemical Brain Thrombosis Model (A) Technical procedures of the cold-light-induced thrombosis in the zebrafish brain. (B) The red box indicates the image area in (C) and (D). Dorsal view, anterior upward. (C) DA injection of Rhodamine followed by cold light illumination was ineffective on local brain blood vessels (n = 10/10). Scale bar, 50 μm. (D) 1 day post DA injection of Rosa bengal and a 600-s-illumination (1 dpi), local cerebrovascular damage was evident in the illuminated area (dotted circle). By 2 dpi, meningeal lymphatics (arrow) grew into the injured area. Nascent blood vessels (ACeV) grew along the ingrown lymphatics, and vascular regeneration fulfilled by 4 dpi. From 6 to 7 dpi, the ingrown lymphatics become clear from the injured area (n = 15/20). Arrowheads indicate the leading edge of growing blood vessels. Scale bar, 50 μm. See also Figure S7 and Video S6. (E) Illustrations of the ingrown lymphatics-mediated brain vascular regeneration. AceV, anterior (rostral) cerebral vein; BV, blood vessel; PrA, prosencephalic artery. |
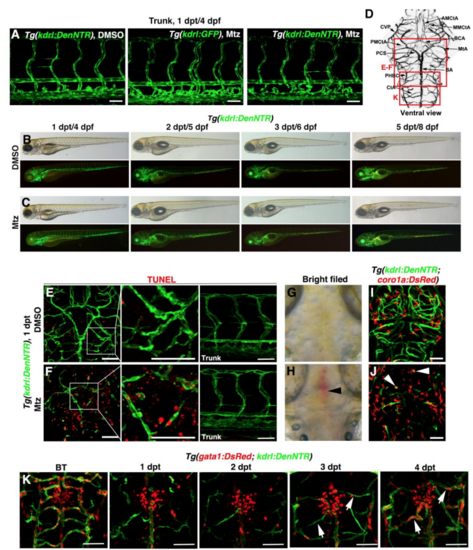
Effects of the Mtz treatment, Related to Figure 1. (A) Mtz treatment was ineffective to the trunk vasculature. (B and C) Compared to DMSO treatment (B, n=20/20), the body phenotypes of larvae treated with Mtz were normal from 1 dpt to 5 dpt (C, n=20/20). Lateral view, anterior left. (D) Boxes on the brain vasculature map indicate image areas in corresponding panels. (E and F) In contrast to DMSO treatment (E, n=32/32), widespread TUNEL signals were detected in the injured brain area including endothelial and neuronal tissues at 1 dpt after Mtz treatment, but not in the trunk vasculature (F, n=29/30). Scale bar, 50 μm. Ventral view, anterior upward. (G and H) In contrast to DMSO treatment (G, n=71/71), Mtz treatment led to hemorrhages (arrowhead) in the injured area (H, n=41/62) at 1 dpt. Dorsal view, anterior upward. (I and J) In contrast to DMSO treatment (I, n=23/23), macrophage infiltration and engulfment of dead cells (arrowheads) were observed after Mtz treatment (J, n=32/32). Dorsal view, anterior upward. (K) Perfusions of nascent blood vessels were initially detectable at 4 dpt under the Tg(gata1:DsRed; kdrl:DenNTR) transgenic background (arrows, n=10/10). Dorsal view, anterior upward. Scale bar, 50 μm. AMCtA, anterior (rostral) mesencephalic central artery; BA, basilar artery; BCA, basal communicating artery; CtA, central artery; CVP, choroidal vascular plexus; MMCtA, middle mesencephalic central artery; MtA, metencephalic artery; PCS, posterior (caudal) communicating segment; PHBC, primordial hindbrain channel; PMCtA, posterior (caudal) mesencephalic central artery. |
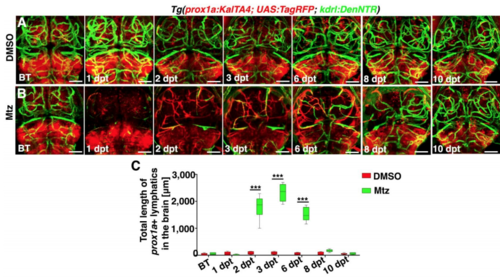
Time courses of meningeal lymphatic ingrowth and cerebrovascular regeneration shown by the prox1a promoter-driven transgene, Related to Figure 1 and Figure 2. (A–C) In contrast to DMSO treatment (A, n=35/36), a time course of meningeal lymphatic ingrowth and neoangiogenesis after Mtz treatment was exhibited (B, n=33/36). Images of 10 dpt showed a complete regeneration of brain vasculature. The quantifications show the total length of prox1a+ lymphatics (C, n=8. Two-way ANOVA by Dunnett’s multiple comparisons test. All P<0.0001). Dorsal view, anterior upward. Scale bar, 50 μm. Data are represented as mean ± SEM. ***P<0.001. |
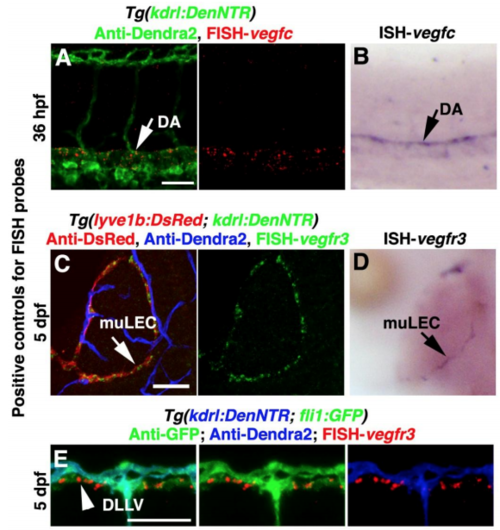
Positive controls for FISH probes, Related to Figure 3. (A and B) The vegfc probe was positive controlled by the comparison of FISH (A, n=23/24) and traditional in situ hybridizations (ISH) (B, n=20/20). Arrows indicate the staining in the dorsal aorta (DA), Lateral view, anterior left. (C–E) The vegfr3 probe was validated by the comparison of FISH (C, n=20/20, dorsal view, anterior upward) and ISH (D, n=21/21, dorsal view, anterior upward) as well as by its staining in the dorsal longitudinal lymphatic vessel (DLLV) (E, arrowhead, n=19/19, lateral view, anterior left). Arrows indicate the staining in the muLECs. Scale bar, 50 μm. |
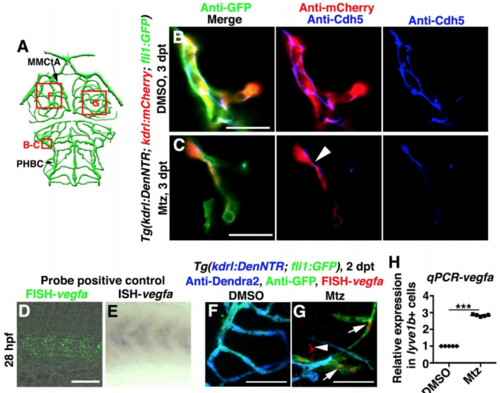
Enrichment of Cdh5 at the lymphatic-vascular interface and expression of vegfa in LECs, Related to Figure 5. (A) Illustrations of lower middle layer brain vascular network indicate the image areas (red boxes) in panels. (B–C) Cdh5 was present in normal cerebrovascular endothelial-endothelial junctions in the control (B, n=16/17). After Mtz treatment, Cdh5 was enriched at the lymphatic (fli1+kdrl-)-vascular (kdrl+) interface at 3 dpt (C, arrowhead, n=14/17). Scale bar, 20 μm. Ventral view, anterior upward. (D–H) The vegfa probe was positive controlled by the comparison of FISH (D, n=21/21) and ISH (E, n=20/20). Lateral view, anterior left. In contrast to the control (F, n=21/22), vegfa expression at 2 dpt was observed in the ingrown LECs (arrows) and other cell types (arrowhead) (G, n=17/20). Ventral view, anterior upward. RT-qPCRs using lyve1b+ cells sorted from the brain confirmed the elevated expression level of vegfa in the ingrown LECs comparing to physiological muLECs (H, n=5). Data are represented as mean ± SEM. ***P<0.001. Scale bar, 50 μm. MMCtA, middle mesencephalic central artery; PHBC, primordial hindbrain channel.v |
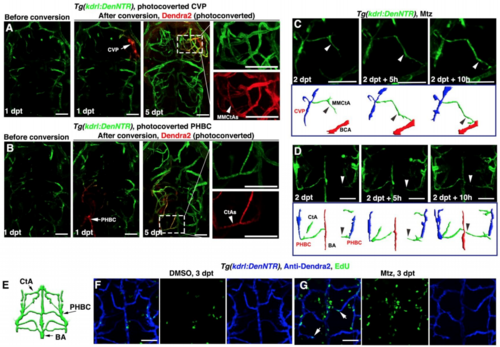
The regenerating blood vessels arise from residual blood vessels through cell proliferation and migration, Related to Figure 1. (A and B) At 1 dpt after Mtz treatment, the residual blood vessels CVP (A, arrow) and PHBC (B, arrow) were photoconverted from green to red fluorescence. At 5 dpt, retentions of the Dendra2-red fluorescence were detected in nascent blood vessels MMCtAs (A, arrowhead, n=9/10) and CtAs (B, arrowhead, n=8/10), respectively. (C and D) Live imaging of the nascent MMCtA and CtA formation. Nascent MMCtA was observed to migrate from CVP to BCA (C, arrowheads, n=10/10), while nascent CtA migrated from PHBC to BA (D, arrowheads, n=10/10), accompanied by explanatory schematic diagrams. (E–G) Illustration of hindbrain vascular network indicate the image area in following panels (E). In contrast to DMSO treatment in which brain BECs rarely proliferated (F, n=20/20), many of nascent BECs were positive for EdU labeling at 3 dpt after Mtz treatment (G, arrows, n=19/21). All images are dorsal view, anterior upward. Scale bar, 50 μm. BA, basilar artery; BCA, basal communicating artery; CtA, central artery; CVP, choroidal vascular plexus; MMCtA, middle mesencephalic central artery; PHBC, primordial hindbrain channel. |
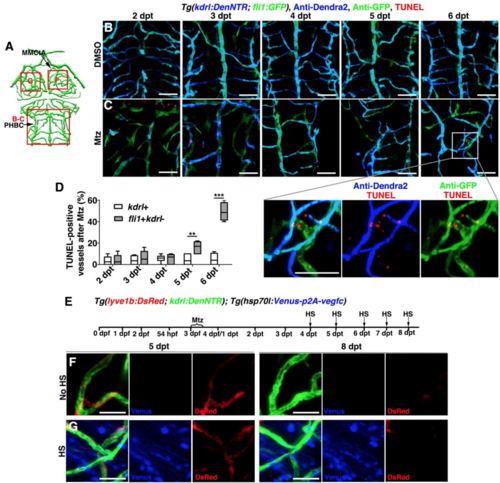
Apoptosis of the ingrown LECs after cerebrovascular regeneration, Related to Figures 6. (A) Illustrations of lower middle layer brain vascular network indicate the image areas (red boxes) in panels. (B–D) The TUNEL signals at 2-6 dpt after DMSO (B, n=16/18, 15/16, 16/19, 17/18, 15/16) or Mtz treatment (C, n=17/18, 14/17, 16/17, 15/18, 15/17). Note that the TUNEL signals gradually increased in the ingrown LECs (fli1+kdrl-) from 5 dpt onward. The statistics show the ratios of the TUNEL-positive vessels after Mtz treatment (D, n=6, Two-way ANOVA by Dunnett’s multiple comparisons test. kdrl+, 5 dpt vs fli1+kdrl-, 5 dpt, P=0.0025; kdrl+, 6 dpt vs fli1+kdrl-, 6 dpt, P<0.0001). Data are represented as mean ± SEM. ***P<0.001, **P<0.01. Ventral view, anterior upward. Scale bar, 50 μm. (E–G) Vegfc overexpression could not inhibit the clearance of ingrown lymphatic vessels. Transgenic lines, time points of Mtz treatment and heat-shock were shown in (E). Similar to the control larvae without heat-shock (F, n=9/9), overexpression of Vegfc by heat-shock was ineffective to clearance of lymphatic vessels at 8 dpt (G, n=10/12). Dorsal view, anterior upward. Scale bar, 20 μm. MMCtA, middle mesencephalic central artery; PHBC, primordial hindbrain channel. |
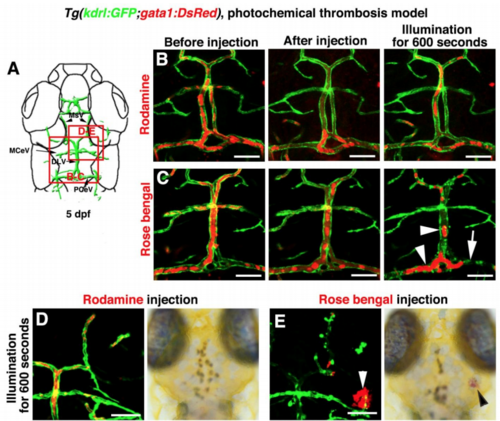
Photochemically induced thrombosis and hemorrhage in the zebrafish brain, Related to Figure 7 and Video S6. (A–C) Illustration of top layer brain vasculature at 5 dpf indicate image areas in panels. All images are dorsal view, anterior upward (A). Injection of Rhodamine followed by illumination was ineffective to the brain blood vessels (B, n=9/9). Injection of Rose bengal followed by a 600-second illumination caused thrombosis and damage to local brain blood vessels in the illuminated area (C, n=16/17). Arrowheads indicate the clogged erythrocytes. Arrow indicates damage to PCeV blood vessel. (D–E) In contrast to the Rhodamine injection (D, n=10/10), Rose Bengal injection followed by a 600-second illumination caused cerebral hemorrhage (E, arrowheads, n=10/12). Scale bar, 50 μm. DLV, dorsal longitudinal vein; MCeV, middle cerebral vein; MsV, mesencephalic vein; PCeV, posterior (caudal) cerebral vein |
Reprinted from Developmental Cell, 49(5), Chen, J., He, J., Ni, R., Yang, Q., Zhang, Y., Luo, L., Cerebrovascular Injuries Induce Lymphatic Invasion into Brain Parenchyma to Guide Vascular Regeneration in Zebrafish, 697-710.e5, Copyright (2019) with permission from Elsevier. Full text @ Dev. Cell