
- Title
-
Local heat-shock mediated multi-color labeling visualizing behaviors of enteric neural crest cells associated with division and neurogenesis in zebrafish gut
- Authors
- Kuwata, M., Nikaido, M., Hatta, K.
- Source
- Full text @ Dev. Dyn.
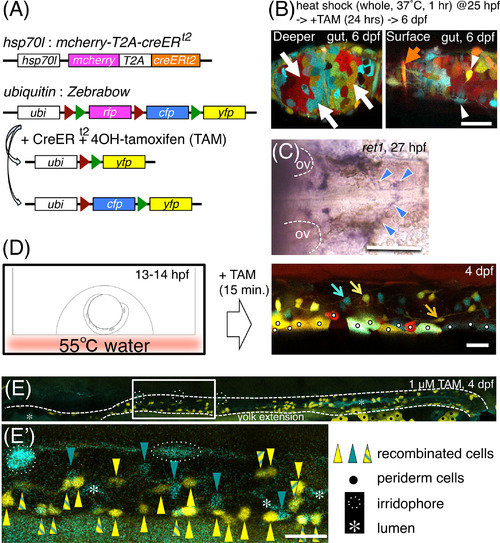
Local heat‐shock‐induced multicolor labeling of enteric neurons. Heterozygotic crosses between Tg(hsp70l:mcherry‐T2A‐creER t2) and Tg(ubiquitin:Zebrabow) were used. A, Constructs introduced into the transgenic fish. B, Zebrabow‐derived hues mark the multiple tissue types of the gut dissected at 6 dpf, after heat shock to whole embryos as indicated. Left panel: mucosal level. Right panel: a level near the surface. White arrows: mucosal cells (red, RFP; yellow, YFP; cyan, CFP). Orange arrow: a putative circular muscle cell. White arrowheads: enteric neuron‐like cells. Scale bar = 20 μm. C, ENCCs at 27 hpf, migrating toward the midline of the pharyngeal region, marked by the in situ hybridization of ret1. Blue arrowheads: ret1+ ENCCs. Otic vesicles (OV) are outlined by dashed lines. Dorsal view. Anterior, to the left. Scale bar = 100 μm. D, Application of local heat shock to the dorsal vagal area by floating an embryo on hot water (55 °C) for 3 sec. Enteric neurons (marked by arrows in blue, yellow, or orange) were detected in the gut at 4 dpf. White dots: accidentally marked periderm cells. Lateral view of the distal intestine. Anterior, to the left. Dorsal, to the top. Scale bar = 25 μm. E,E′, YFP+ cells and CFP+ cells are mixed with each other in the gut at 4 dpf. E′, An expanded image of E. White dashed lines: guts. Yellow triangles: YFP+ cells. Turquoise triangles: CFP+ cells. Yellow triangles with turquoise stripes: YFP+/CFP+ cells. Black dots: periderm cells. White dotted lines encircle iridophores. White asterisks: intestinal lumen. Lateral view of the gut. Anterior, to the left. Scale bar = 25 μm in E′ |
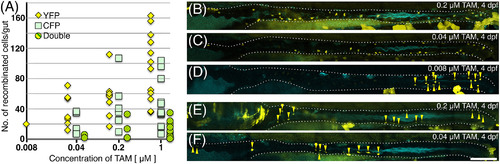
The number and distribution of ENCCs recombined in the gut at different concentrations of TAM. We treated heat‐shocked Tg(hsp:cre) x Tg (ubi:ZB) embryos with different concentrations of TAM, and counted the YFP+, CFP+, and YFP/CFP‐double+ cells in the left side of the gut at ca. 110 hpf. A, The number of recombinant ENCCs in the gut detected by YFP or CFP was dependent on the TAM concentration. More YFP+ cells were detected than CFP+ cells, probably because of the weaker signal of CFP. Numbers of RFP+ embryos examined for each concentration are 11 for 0.008 μM, 17 for 0.04 μM, 19 for 0.2 μM, and 18 for 1 μM. B‐F, Representative examples from each TAM (0.008‐0.2 μM) treatment. Samples E and F show the smallest number of YFP+ cells at each concentration of TAM. Some groups of cells were localized, whereas others were distributed along the anterior–posterior axis of the gut. White dotted lines outline the guts. Yellow triangles: YFP+ cells. Scale bar = 100 μm in F |
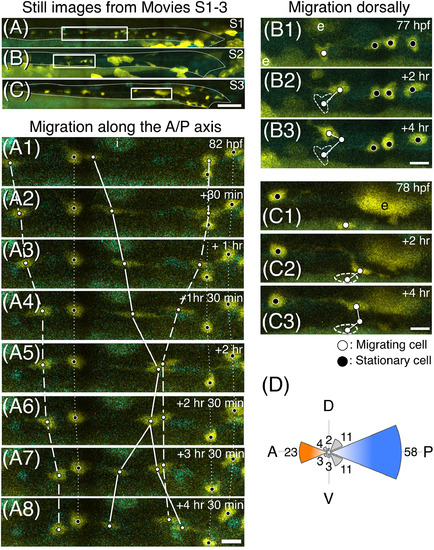
Multi‐directional migration of ENCCs shown by time‐lapse live imaging. A‐C, Still images from Supplementary Movies S1‐3. Each rectangle indicates the area shown in A1‐8, B1‐3, and C1‐3, respectively. Guts are outlined with white dashed lines. Lateral views of the gut. Anterior, to the left. Scale bar = 50 μm. A1‐8, Still images of a part (images were taken every 30 or 60 min over a period of 4 hr and 30 min starting at 82 hpf) of Supplementary Movie S1. Active migration was observed along the antero‐posterior axis. White dots: migrating cells. Black dots: stationary cells. The same cells in each panel are connected with a solid line (dividing cell), a dashed line (migrating cells), or a dotted line (stationary cells). B1‐3 and C1‐3, Two sets of still images of different embryos showing cells migrating dorsally in a zig‐zag manner (#1 and #2). The trajectory of each cell is shown by white lines, and the original positions of cells seen in (B1, C1) are encircled by white dashed lines in B2, B3 and C2, C3, respectively. Developmental stages are shown in the top right corner in each panel. e: periderm cells. i: iridophore. Scale bars = 10 μm. D, Polar histogram representing the directions of the migration at 1‐hr intervals. The directions were determined by constructing a straight line from a position of cell with its position 1 hr after migration. The number of cells that migrate in each direction represented by an octant during 1‐hr period is proportional to its radius |
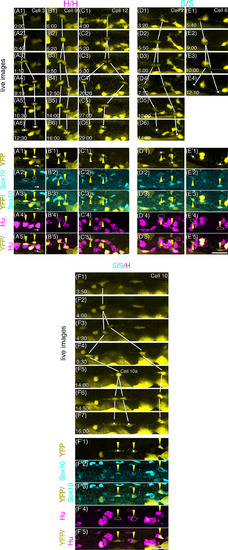
Positions and orientations of neural crest cell divisions in the gut. A‐M, Projection images at the time of division prepared by using time‐lapse movies from five embryos in the posterior midgut and entire hindgut for 12‐29 hr between ca. 3 and 4 dpf. Images are aligned according to the developmental stage shown in the bottom‐left corners. Cell ID numbers are shown in the top‐right corners. The cells about to divide are indicated with magenta triangles, and their close‐up images (A′‐M′) and daughter cells (yellow triangles) at indicated time after division are shown in panels on the right. The white dashed line outlines the gut in (A). Scale bar = 50 μm. N, Schematic drawing of the positions of identified ENCC divisions. A black dashed line outlines the gut, and the grey line represents the position of the lumen. O, Summary of the orientation of each cell division |
|
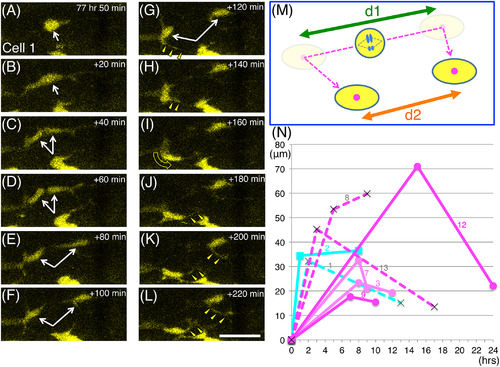
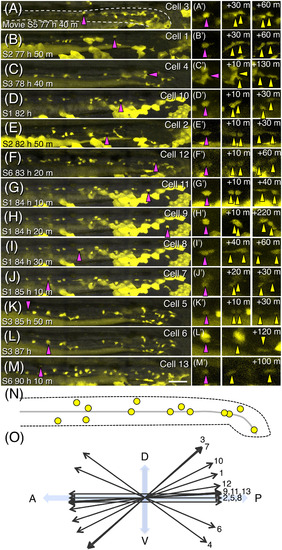
Behavior of daughter cells after ENCC division. Most of the sibling cells migrated apart at first, then later changed direction and came closer to each other. A‐L, Serial images of the division process of cell no. 1. Images were taken every 20 min, starting at 77 hr 50 min postfertilization as shown in the top‐right corners. White arrows in A‐G indicate cell no. 1 before (A,B) and after (C‐G) separation. The yellow triangles in G‐L mark cellular processes that extend from the daughter cells toward the direction of migration (the curved yellow arrow in I). Scale bar = 25 μm. M, A schematic drawing of the behavior of cell no. 1 daughter cells. Daughter cells first moved apart from each other, and thereafter often changed direction (dashed magenta arrow). We measured the distances in the movies just before these cells changed direction (d1) and at the end of the movies (d2). N, The distance between each pair of daughter cells (the same cells described in Figures 4-6; the cell no. is indicated with each graph) is shown in terms of time after division. Data plotted with circular markers with strong and weak magenta lines are for cells that produced only strongly and weakly Hu + neurons respectively, and the data plotted with rectangular markers with cyan lines are for cells that produced Sox10+ cells. Data plotted with crosses and dashed lines are for cases in which one of the daughter cells was Hu‐/Sox10‐ (see Figure 5) |