
- Title
-
The Neuromodulator Adenosine Regulates Oligodendrocyte Migration at Motor Exit Point Transition Zones
- Authors
- Fontenas, L., Welsh, T.G., Piller, M., Coughenour, P., Gandhi, A.V., Prober, D.A., Kucenas, S.
- Source
- Full text @ Cell Rep.
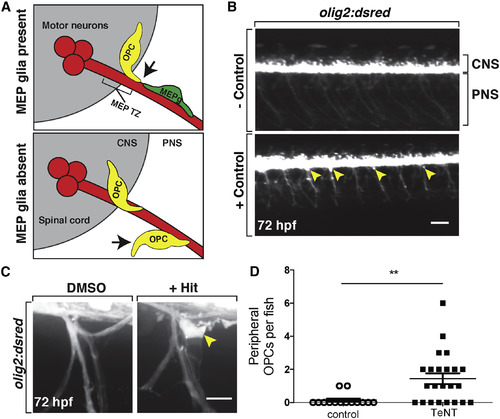
Small-Molecule Screen Identifies Compounds that Disrupt OPC Migration at the MEP TZ (A) Schematic of a transverse view of the MEP TZ. MEP glia (MEPg; green) prevent OPC (yellow) exit from the spinal cord (gray). OPC processes (arrow) contact MEP glia but are repelled. Without MEP glia, OPCs migrate onto peripheral nerves. (B) Low-magnification images showing lateral views of negative (top) and positive (bottom) controls at 3 dpf in olig2:dsred larvae. Peripheral olig2+ cells are denoted with yellow arrowheads. (C) Images of control and validated hits in 3 dpf olig2:dsred larvae showing ectopic OPCs (arrowhead) along spinal motor nerves. (D) Mean ± SEM of peripheral OPC count for larvae injected with injection buffer (control) or TeNT mRNA at 3 dpf. p = 0.0013; n = 14 control, n = 23 TeNT. Scale bars, 100 μM in (B) and 20 μM in (C). EXPRESSION / LABELING:
PHENOTYPE:
|
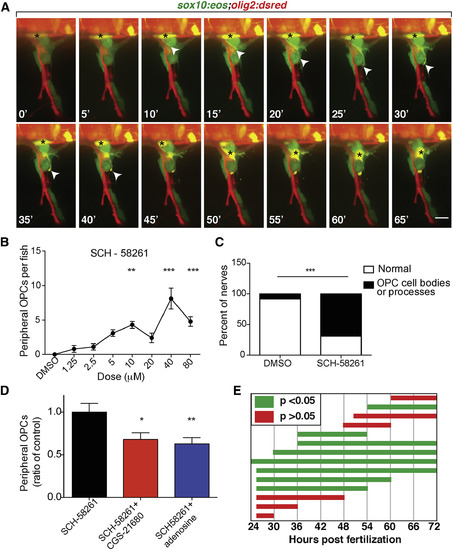
A2a AR Antagonist Causes OPC Migration through the MEP TZ (A) Frames captured from a 15 h time-lapse movie of a sox10:eos;olig2:dsred larva treated with CGS-15943 from 24 hpf to 3 dpf and imaged from 57 to 72 hpf; 0′ is 58 hpf. The black asterisk marks OPC body. Arrowheads mark OPC leading process. (B) Dose-response curve of the number of peripheral OPCs for fish treated from 24 hpf to 3 dpf with SCH-58261. Mean ± SEM, n = 10 larvae per dose; ∗∗p < 0.01 and ∗∗∗p < 0.0001. (C) Percentage of nerves at 3 dpf that have ectopic OPC processes and/or cell bodies. n = 60 DMSO, n = 98 SCH-58261; p < 0.01. (D) Mean ± SEM of peripheral OPCs in olig2:dsred larvae treated with 10 μM SCH-58261 alone or in combination with 2.5 μM CGS-21680 or 5 μM adenosine from 36 hpf to 3 dpf. n = 30 fish per treatment; ∗p < 0.05 and ∗∗p < 0.01. (E) Peripheral OPC counts for larvae treated with 10 μM SCH-58261 during distinct time periods. Green bars indicate mean peripheral OPC counts significantly above DMSO control (p < 0.05). Red bars indicate mean peripheral OPC counts not significantly different than DMSO (p > 0.05). n = 9–12 larvae per condition. Scale bar, 20 μM. EXPRESSION / LABELING:
PHENOTYPE:
|
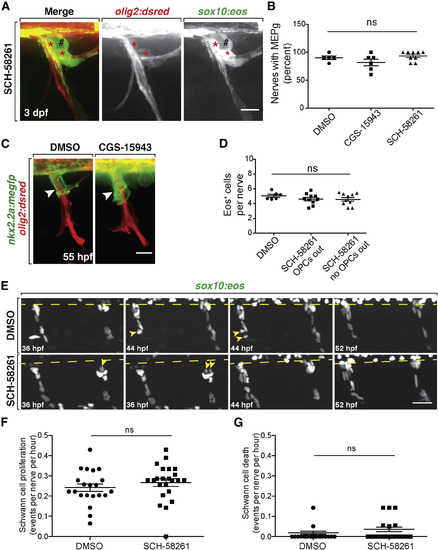
A2a AR Antagonism Does Not Affect Spinal Motor NerveDevelopment (A) Motor nerve in a 3 dpf olig2:dsred;sox10:eos larvae treated with SCH-58261 from 36 hpf to 3 dpf. Red asterisks mark sox10+/olig2+ MEP glia at the MEP TZ. Black pound signs denote sox10+/olig2− dorsal root ganglia. (B) Mean ± SEM of the percentage of nerves per larva at 3 dpf with sox10+/olig2+ MEP glia after treatment from 36 hpf to 3 dpf with DMSO (n = 5), CGS-15943 (n = 6), or SCH-58261 (n = 9). Ten nerves were quantified per larva. p = 0.14. (C) Fifty-five hours post-fertilization nkx2.2a:megfp;olig2:dsred larvae treated with DMSO or CGS-15943 from 36 to 55 hpf showing PG extension (arrowheads) on the nerve. (D) Quantification of Eos+ cells per nerve at 3 dpf in DMSO and SCH-58261-treated larvae. Mean ± SEM for DMSO (n = 6 fish) and SCH-58261 (n = 10 fish). Ten nerves per fish. p = 0.39. (E) Frames captured from a 20 h time-lapse video starting at 36 hpf in sox10:nls-eos embryos treated with DMSO or SCH-58261. The spinal cord is denoted by a dashed line. SCs divide (yellow arrowheads) along the nerves in both treatments. (F) Quantification of SC proliferation during these time lapses. Mean ± SEM for DMSO (n = 6 fish, 21 nerves) and SCH-58261 (n = 6 fish, 23 nerves). p = 0.35. (G) Quantification of SC death during these time-lapse movies. Mean ± SEM for DMSO (n = 6 fish, 21 nerves) and SCH-58261 (n = 6 fish, 23 nerves). p = 0.20. Scale bars, 20 μM. |
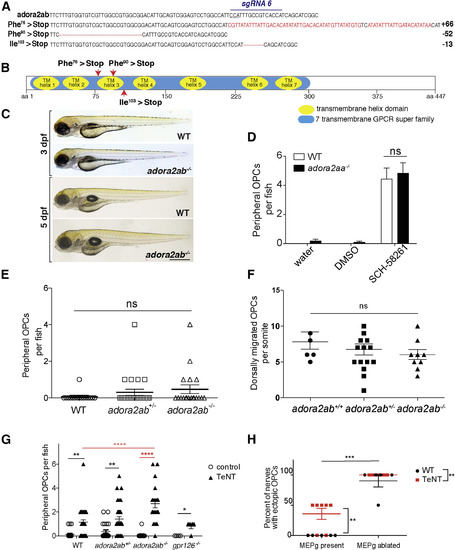
A2ab ARs Influence OPC Migration at the MEP TZ (A) adora2ab WT and germline CRISPR mutant DNA sequences. sgRNA target and PAM site (underlined) are shown on WT sequence. Red letters or dashes indicate insertions or deletions. (B) Diagram of A2ab protein with locations of early stops caused by adora2abuva6, adora2abuva7, and adora2abuva9. (C) Bright-field images of WT and adora2ab−/− siblings at 3 and 5 dpf. (D) Mean ± SEM of peripheral OPCs per fish for olig2:dsred;adora2aa−/−and WT larvae treated with water, DMSO, or 10 μM SCH-58261 from 36 hpf to 3 dpf. n = 12 fish; p < 0.0001 for treatment, p = 0.53 for genotype, p = 0.93 for interaction of treatment and genotype. (E) Mean ± SEM of peripheral OPCs per fish for olig2:dsred;adora2ab−/−, adora2ab+/−, and WT larvae. p = 0.32; n = 19 adora2ab−/−, n = 26 adora2ab+/−, and n = 16 WT. (F) Mean ± SEM of dorsally migrated OPCs per somite at 72 hpf. p = 0.43; n = 6 WT, n = 16 adora2ab+/−, n = 9 adora2ab−/−. (G) Mean ± SEM of peripheral OPCs per fish for olig2:dsred;adora2ab−/−, gpr126−/−, and WT larvae injected with injection buffer (control) or TeNT mRNA. ∗∗p = 0.0088 (WT versus WT + TeNT), ∗∗p = 0.0053 (adora2ab+/− versus adora2ab+/− + TeNT), and ∗∗∗∗p < 0.0001 (adora2ab−/−versus adora2ab−/− + TeNT); p = 0.99 (WT + TeNT versus gpr126−/− + TeNT) and (WT + TeNT versus adora2ab−/− + TeNT). n = 22 WT, n = 22 adora2ab+/−, n = 13 adora2ab−/−, n = 36 WT + TeNT, n = 32 adora2ab+/− + TeNT, n = 20 adora2ab−/− + TeNT, n = 4 gpr126+/+, and n = 5 gpr126−/− + TeNT. Red asterisks highlight significant comparisons relevant for the experiment. (H) Mean ± SEM of the percentage of nerves with peripheral OPC bodies and/or processes at 3 dpf following TeNT mRNA injections and/or MEP glial ablation. For each WT or TeNT-injected larva, two nerves were analyzed with MEP glia ablated, and two nerves were analyzed with MEP glia intact in the same larva. n = 5 larvae (uninjected), n = 7 larvae (TeNT). ∗∗p = 0.004 for TeNT versus WT, p < 0.0001 for MEP glia ablated versus MEP glia present. Scale bar, 0.5 mm. |
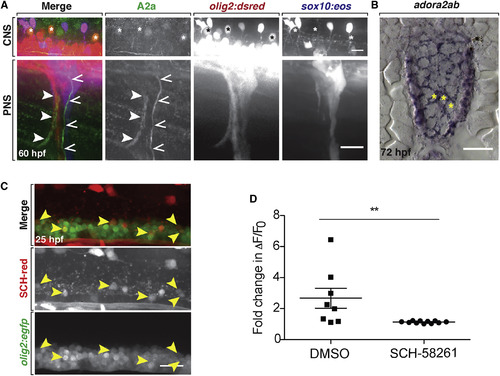
A2a AR Inhibition Reduces Neural Activity of Spinal Cord Neurons (A) Lateral views of a 60 hpf WT olig2:dsred;sox10:eos larva stained with an A2a AR antibody. Top: spinal cord (CNS) with A2a expression in a subset of olig2+ motor neurons (asterisks). Bottom (PNS): peripheral spinal nerves with A2a expression in motor (closed arrowheads) and sensory (open arrowheads) axons. (B) adora2ab mRNA expression at 72 hpf in the spinal cord of a WT larva. Yellow asterisks denote motor neurons. (C) Twenty-five hours post-fertilization olig2:egfp embryo labeled with SCH-red fluorescent antagonist. Arrowheads mark spinal cord olig2+/SCH-red+ motor neurons. (D) Mean ± SEM of the fold change in ΔF/F0 over time per individual firing event for larvae treated with DMSO (n = 8 neurons from eight larvae) and SCH-58261 (n = 11 neurons from ten larvae); p = 0.01. Scale bars, 20 μM. EXPRESSION / LABELING:
|
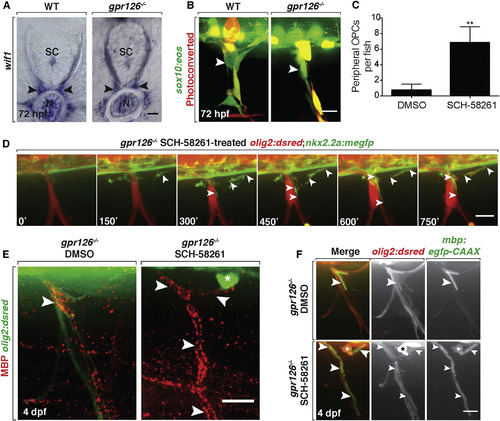
Peripheral OPCs Myelinate Spinal Motor Axons in gpr126Mutant Larvae (A) wif1 mRNA expression in WT and gpr126−/− larvae at 3 dpf shows MEP glia (arrowheads). SC, spinal cord; N, notochord. (B) Live images of photoconverted sox10:eos larvae at 3 dpf show Eos+MEP glia (arrowheads) in both WT and gpr126−/− larvae. (C) Mean ± SEM of peripheral OPCs in 3 dpf gpr126−/− larvae treated with DMSO or SCH-58261 from 36 hpf to 3 dpf. n = 8 DMSO, n = 6 SCH-58261. ∗∗p = 0.009. (D) Frames from a 15 h time-lapse movie of a olig2:dsred;nkx2.2a:megfp;gpr126−/− larva treated with SCH-58261 from 36 hpf to 3 dpf; 0′ is 57 hpf. Arrowheads mark a nkx2.2a+/olig2+ OPC ensheathing motor axons. (E) Images of MBP antibody (arrowheads) on peripheral nerves of 4 dpf olig2:dsred;gpr126−/− larvae treated with DMSO or SCH-58261 from 36 hpf to 3 dpf. Asterisk marks peripheral OPC. (F) Live images of 4 dpf WT and gpr126−/−;olig2:dsred;mbp:egfp larvae treated with DMSO or SCH-58261 from 36 hpf to 3 dpf. Asterisk marks olig2+ peripheral OPC with mbp+ membrane sheaths (arrowheads) around peripheral motor axons. Scale bars, 20 μm. EXPRESSION / LABELING:
PHENOTYPE:
|
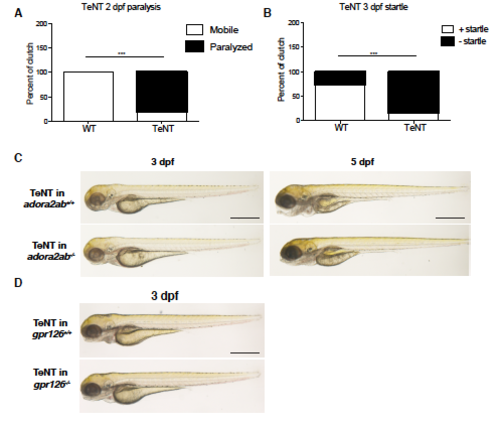
Blocking of vesicular release results in larval paralysis. (A) Percentage of embryos that were mobile or paralyzed during dechorionation with forceps at 2 dpf. Analyzed by Chi-squared test; ***p<0.0001, n = 54 (WT), n = 57 (TeNT). (B) Percentage of fish with positive and negative startle responses at 3 dpf. Analyzed by Fisher’s exact test; ***p<0.0001, n = 52 (WT), n = 53 (TeNT). (C) Brightfield images of 3 and 5 dpf WT and adora2ab-/- siblings injected with TeNT mRNA at the one-cell stage. Note that in the 5 dpf larvae, neither WT nor adora2ab mutants have inflated swim bladders because of their inability to swim and get to the surface of the petri dish to gulp air in order to inflate their swim bladder. (D) Brightfield images of 3 dpf WT and gpr126-/- siblings injected with TeNT mRNA at the one-cell stage. Scale bars (C&D), 0.5 mm. |
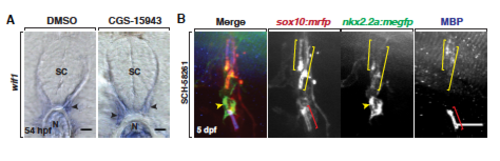
A2a antagonism does not affect spinal motor nerve development. (A) In situ hybridization for wif1 in 54 hpf larvae treated 36 to 54 hpf with DMSO or 1.25 μM CGS-15943. Arrowheads denote MEP glia. SC, spinal cord; N, notochord. (B) Image of a 5 dpf larva treated from 30 hpf to 3 dpf with SCH-58261. Arrowhead marks a nkx+/sox10+ oligodendrocyte on the nerve, which is myelinating proximal segments of the nerve with nkx+/sox10+/MBP+ myelin (yellow brackets). A differentiated Schwann cell also myelinates a nerve segment with a nkx-/sox10+/MBP+ myelin sheath (red bracket). Scale bars, (A) 20 μm, (B) 50 μm. |
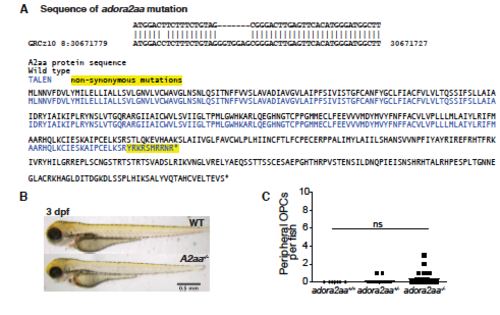
Characterization of adora2aa mutant larvae. (A) DNA sequence (top) and predicted protein sequence of adora2aact845 compared to WT. (B) Brightfield images of 3 dpf WT and adora2aa-/- larvae. (C) Mean ± SEM of peripheral OPCs per larvae for adora2aa+/- and adora2aa-/- larvae at 3 dpf. p=0.24, n = 20 (adora2aa+/-), n = 26 (adora2aa-/-). Scale bar, 0.5 mm. |
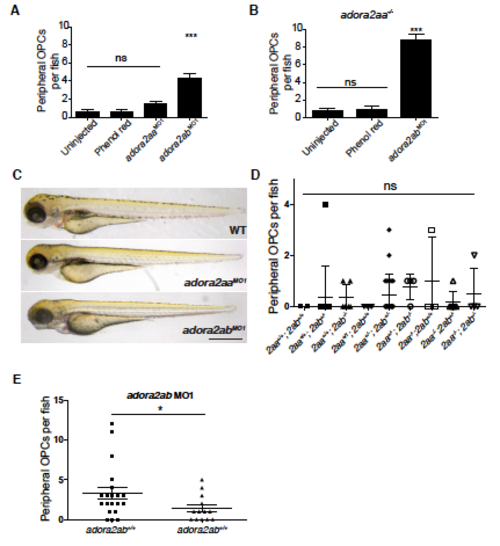
Knockdown of adora2ab, but not adora2aa, results in peripheralmOPCs. (A) Mean ± SEM of peripheral OPCs in WT olig2:dsred embryos injected with vehicle, 1 ng/nl adora2aa MO1 or 1 ng/nl adora2ab MO1. n = 42 (WT), n = 11 (phenol red), n = 65 (adora2aa MO1) and n = 42 (adora2ab MO1). ***p<0.0001 adora2ab MO1 compared to uninjected. (B) Mean ± SEM of peripheral OPCs at 3 dpf in olig2:dsred;adora2aa-/- larvae injected with adora2ab MO1. n = 44 (uninjected), n = 30 (phenol red) and n = 84 (adora2ab MO1). ***p<0.0001 compared to uninjected. (C) Brightfield images of 3 dpf WT, adora2aa and adora2ab morphant larvae. (D) Mean ± SEM of peripheral OPCs at 3 dpf in olig2:dsred;adora2aa-/-;adora2ab-/- larvae. p=0.75, n = 2 (adora2aa+/+;adora2ab+/+), n = 11 (adora2aa+/+; adora2ab+/-), n = 6 (adora2aa+/+; adora2ab-/-), n = 8 (adora2aa+/-; adora2ab+/+), n = 20 (adora2aa+/-; adora2ab+/-), n = 4 (adora2aa+/-; adora2ab-/-), n = 3 (adora2aa-/-; adora2ab+/+), n = 6 (adora2aa-/-; adora2ab+/-) and n = 4 (adora2aa-/-; adora2ab-/-). Scale bar, 0.5 mm. (E) Mean ± SEM of peripheral OPCs at 3 dpf in olig2:dsred;adora2ab-/- and adora2ab+/+ larvae injected with 1ng/nl adora2ab MO at the one-cell stage. *p = 0.03, n = 20 (adora2ab+/+); n = 13 (adora2ab-/-). |