
- Title
-
Identification of a 42-bp heart-specific enhancer of the notch1b gene in zebrafish embryos
- Authors
- Wang, F., Yang, Q., Wu, F., Zhang, Y., Sun, S., Wang, X., Gui, Y., Li, Q.
- Source
- Full text @ Dev. Dyn.
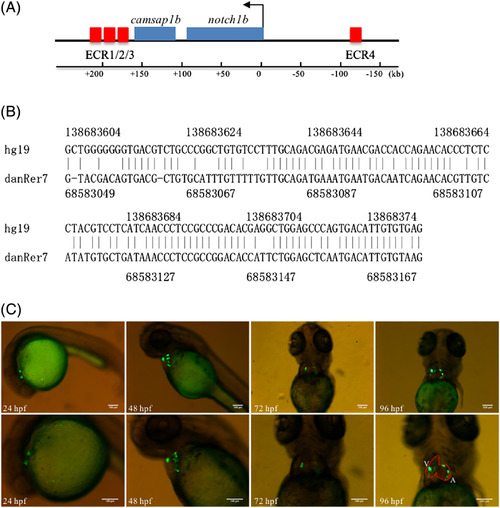
Identification of heart‐specific enhancers around notch1b. A, ECR distribution near the zebrafish notch1b locus based on the danRer7 assembly. Genes are shown as blue rectangles and the orientation of arrows indicate the translational initiation sites of genes. The ECRs located near the notch1b gene are indicated by red rectangles. The horizontal line at the bottom indicates the studied range of the DNA sequence range. B, Sequence conservation between zebrafish (danRer7 assembly) and humans (hg19 assembly). C, ECR3 regulates GFP expression mainly in zebrafish heart. Photos were taken with the GFP channels in the lateral position at 24 hpf and 48 hpf and supine position at 72 hpf and 96 hpf. The images below show an enlarged view of the above embryos. Red curve: outline of the heart; A, atrium; and V, ventricle. Scale bars = 100 μm in all panels |
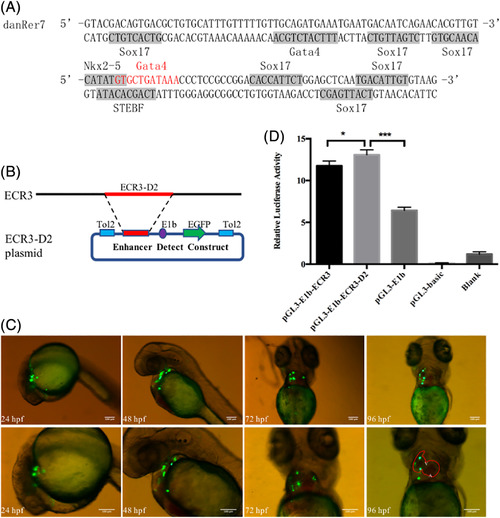
Identified ECR3‐D2 is a heart‐specific enhancer. A, Heart‐related TF distribution in the 127‐bp sequence. The bold gray DNA sequence indicates TF binding sites, and to avoid overlap, the Gata4 binding sequence is marked in red. B, Structure of the ECR3‐D2 plasmid. ECR3‐D2 is a 42‐bp DNA fragment located inside the 127‐bp length of ECR3. The ECR3‐D2 sequence was then cloned into the enhancer‐activity‐detecting construct. C, ECR3‐D2 drives GFP expression in the heart. Photos were taken with the GFP channel in the lateral position at 24 hpf and 48hpf and supine position at 72 hpf and 96 hpf. The images below show an enlarged view of the above embryos. Red curve: outline of the heart; A, atrium; and V, ventricle. Scale bars = 100 μm in all panels. D, Dual luciferase results. The ECR3‐D2‐luciferase vector was transfected into HEK293 cells, and the transfection efficiency was controlled by co‐transfection with a Renilla reporter construct. The p value of the difference between ECR3 and ECR3‐D2 is 0.0118, and the P value of the difference between ECR3‐D2 and E1b is lower than 0.0001 |
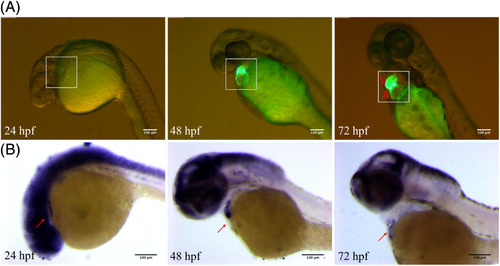
Expression comparison between embryos from ECR3‐D2‐F2 zebrafish and in situ hybridization of the notch1b gene in wild‐type embryos. A, ECR3‐D2 drives GFP expression specifically in the heart at 24 hpf, 48 hpf, and 72 hpf. All images were obtained with an inverted microscope. White boxes indicate the position of the zebrafish heart. A, atrium; V, ventricle. Scale bars = 100 μm in all panels. B, In situ hybridization of the notch1b gene in wild‐type embryos at 24 hpf, 48 hpf, and 72 hpf. All photos were taken with the light channel in a lateral position. Red arrow indicates the location of the heart. Scale bars = 100 μm in all panels EXPRESSION / LABELING:
|
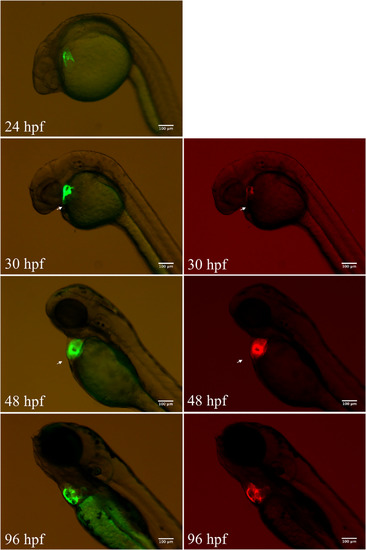
Patterns of ECR3‐D2‐F2‐mediated GFP expression and cmlc2 promoter‐mediated mCherry expression at different stages. Images in the left column show the GFP channel and right columns with the RFP channel. Scale bars = 100 μm in all panels |