
- Title
-
bif1, a new BMP signaling inhibitor, regulates embryonic hematopoiesis in the zebrafish
- Authors
- Ghersi, J.J., Mahony, C.B., Bertrand, J.Y.
- Source
- Full text @ Development
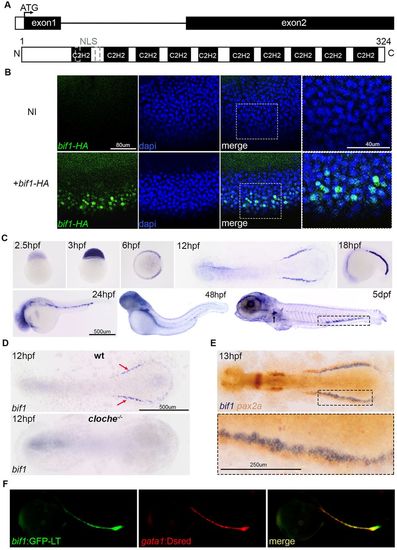
Bif1, a C2H2 zinc-finger protein, is expressed at an early stage and becomes restricted to the erythroid lineage during primitive erythropoiesis. (A) Representation of the bif1 gene and protein structures. NLS, nuclear localization sequence. (B) Immunofluorescence using an antibody against HA and DAPI staining on 6 hpf non-injected embryos or embryos injected with bif1-HAmRNA. The area shown at higher magnification is indicated with a dotted rectangle. (C) Time-course expression of bif1 revealed by whole-mount in situ hybridization. The arrow and the dotted rectangle represents the pronephric glomerulus and the caudal hematopoietic tissue, respectively. (D) Expression of bif1 at 12 hpf in wild type and a cloche mutant. The red arrows show the expression of bif1 that is lost in the cloche mutant. (E) Double whole-mount in situhybridization against bif1 (blue) and pax2 (orange, representing the intermediate mesoderm) at 13 hpf embryos. The area shown at higher magnification is indicated with a dotted rectangle. (F) Images of 23 hpf fluorescent fish carrying two constructs: Tg(bif1:GFP-LT) and Tg(gata1:DsRed). PHENOTYPE:
|
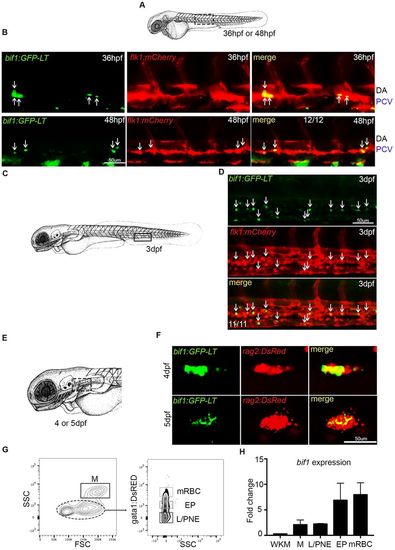
bif1 is also expressed during definitive and adult hematopoiesis. (A) Schematic indicating the approximate area in the trunk shown in the images in B (dotted rectangle). (B) Confocal images of the trunk region of double-positive bif1:GFP-LT and flk1:mcherry embryos at 36 hpf and 48 hpf. Arrows indicate double-positive cells. (C) Schematic indicating the approximate area in the tail shown in the images in D (rectangle). (D) Confocal images of the CHT of double-positive bif1:GFP-LT and flk1:mcherry embryos at 3 dpf. Arrows indicate double-positive cells. (E) Schematic representing the head of a zebrafish at 4 dpf. The position of the thymus is outlined by the dotted rectangle. (F) Confocal images of thymic area of double-positive bif1:GFP-LT;rag2:DsRed embryos at 4 and 5 dpf. (G) Results from FACS-sorted cells of WKM dissected from 1-year-old embryos. n=3. (H) Expression of bif1 by qPCR on FACS-sorted cells, relative to the WKM. Data were obtained from biological triplicates. SSC, side scatter; FSC, forward scatter; M, myeloid; L/PNE, lymphocytes and progenitors non-erythroid; EP, erythroid progenitors; mRBC, mature red blood cells; WKM, whole kidney marrow. |
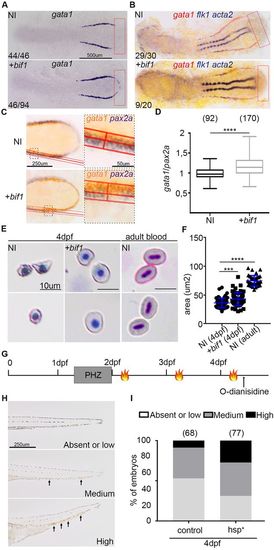
bif1 affects erythropoiesis. (A) Whole-mount in situ hybridization for gata1 at 12 hpf in non-injected embryos or embryos injected with bif1 mRNA. The red rectangle shows the ectopic region where gata1 is expressed in bif1-injected embryos. (B) Double whole-mount in situhybridization, at 14 hpf, for gata1 (red) and flk1 (blue), a marker of the first angioblasts. (C) Whole-mount in situ hybridization for gata1 (orange) and pax2a (blue) in 12 hpf non-injected embryos or embryos injected with bif1 mRNA. The areas shown at higher magnification are outlined with a dotted rectangle. The red line defines the width of expression for these two stainings. (D) For each embryo, we measured the ratio of gata1 and pax2a width. The lowest and highest points of the whiskers indicate the extreme values. The boxes indicate the 25-75th percentile range. (E) May–Grünwald–Giemsa staining of circulating RBCs, from non-injected embryos or embryos injected with bif1 mRNA at 4 dpf and 6 months, after a cytospin. (F) RBC diameters. The symbols indicate individual data points. (G) Experimental outline of the PHZ-induced anemia followed by three heat shocks at 38°C for 45 min (flames). (H) Bright-field images of tails, indicating the different levels of O-dianisidine staining (arrows). (I) Percentage of embryos showing absent or low (light gray), medium (dark gray) or high (black) levels of hemoglobin, as shown by O-dianisdine staining. Statistical analysis was carried out using an unpaired Student's t-test. Data are mean±s.e.m. ****P<0.0001. EXPRESSION / LABELING:
PHENOTYPE:
|
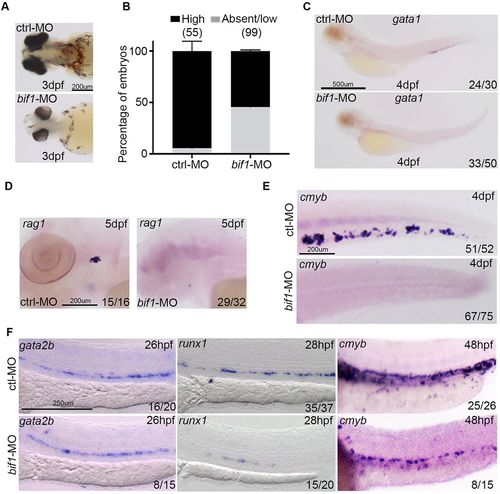
bif1 affects definitive hematopoiesis. (A) Bright-field images from O-dianisidine-stained embryos at 3 dpf. These embryos are injected with a control morpholino or a morpholino against bif1. (B) Percentage of embryos showing absent/low (gray) or high (black) levels of hemoglobin. Data are mean±s.e.m. (C-F) Whole-mount in situ hybridization for gata1 at 4 dpf (C), rag1 at 5 dpf (D), cmyb at 4 dpf (E), gata2b at 26 hpf, runx1 at 28 hpf and cmyb at 48 hpf (F), in embryos injected with control morpholino (ctrl-MO) or morpholino against bif1 (bif1-MO). |
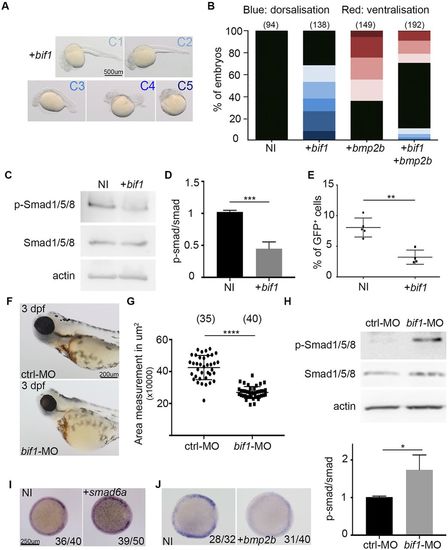
bif1 inhibits the BMP signaling pathway. (A) Bright-field images of 24 hpf embryos injected with bif1 mRNA. The embryos are classified depending of the dorsalization severity. (B) Quantification of embryos exhibiting the corresponding morphologies of dorsalization and ventralization. (C) Western blot of extracted proteins of non-injected embryos or embryos injected with bif1 mRNA at 6 hpf. (D) Quantitative analysis of western blot data. The values were obtained by dividing the p-Smad protein intensity value by its corresponding Smad intensity value. Data are mean±s.e.m. ***P<0.001. (E) Percentage of eGFP cells obtained by FACS analysis on Tg(BRE:eGFP) fishes. Each dot represents a pool of 20 embryos. Data are mean±s.e.m. **P<0.01. (F) Bright-field images from O-dianisidine-stained embryos at 3 dpf. The embryos were injected with control-MO or a bif1-MO. (G) Measurement of the left eye size in the embryos in F (the right eyes produce similar results). Each dot represents one single embryo. Data are mean±s.e.m. ****P<0.0001. (H) Western blot of extracted proteins at 23 hpf. The embryos were injected with a control morpholino or a morpholino against bif1. The graph below indicates the relative intensity of p-Smad protein levels compared with total Smad proteins. Data are mean±s.e.m. *P<0.05. (I) Whole-mount in situ hybridization for bif1 at 6 hpf in embryos injected with smad6 mRNA and non-injected controls. (J) Whole-mount in situ hybridization for bif1 at 6 hpf in embryos injected with bmp2b mRNA and non-injected controls. Statistical analysis was carried out using an unpaired Student's t-test. PHENOTYPE:
|
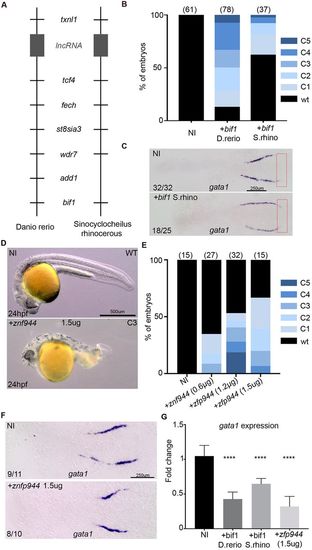
bif1 has orthologs in Sinocyclocheilus rhinocerous and in Mus musculus. (A) Synteny representation of the zebrafish and Sinocyclocheilus rhinocerous genome near to bif1. (B) Percentage of uninjected embryos and embryos injected with D. rerio or S. rhino bif1 mRNA showing a dorsalization morphology at 24 hpf in zebrafish embryos. (C) Whole-mount in situhybridization for gata1 at 12 hpf in non-injected embryos or embryos injected with bif1 S. rhinomRNA. Red rectangle indicates the region in which gata1a is ectopically expressed in bif1-overexpressing embryos. (D) Bright-field images of non-injected embryos or embryos injected with zfp944 mRNA at 24 hpf. (E) Percentage of uninjected and zfp944-injected zebrafish embryos showing a dorsalization morphology at 24 hpf. (F) Whole-mount in situ hybridization for gata1 at 12 hpf in non-injected embryos or embryos injected with zfp944 mRNA. (G) Quantification of gata1 by qPCR, in 48 hpf embryos, either non-injected or injected with D. rerio bif1, S. rhino bif1 or murine Zfp944 mRNA (n=3 biological replicates for all). Statistical analysis was carried out using an unpaired Student t-test. Data are mean±s.e.m. ****P<0.0001. EXPRESSION / LABELING:
|
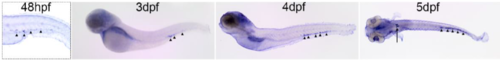
bif1 is expressed in erythropoietic tissue. Lateral picture of WISH against bif1 at 3dpf, 4dpf and at 5dpf on a dorsal view. Black arrowheads represent the expression of bif1 in the CHT. Black arrow shows the expression of bif1 in the glomerulus. |
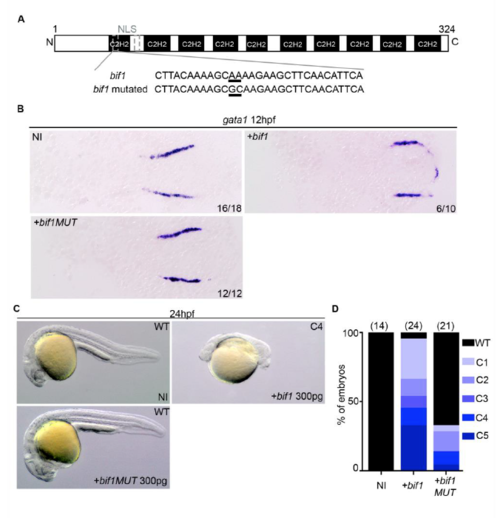
A mutation in bif1-NLS affects its function. (A) Representation of bif1 protein and its nucleotide sequence in the NLS region. The mutation that substitutes a lysine (AAA) to an alanine (GCA) is underlined. (B) WISH against gata1 at 12hpf embryos injected or not with bif1 or bif1 mutated. (C) Bright field images of 24hpf embryos injected or not with bif1 or bif1 mutated. (D) Quantification of embryos exhibiting dorsalized morphologies. EXPRESSION / LABELING:
|
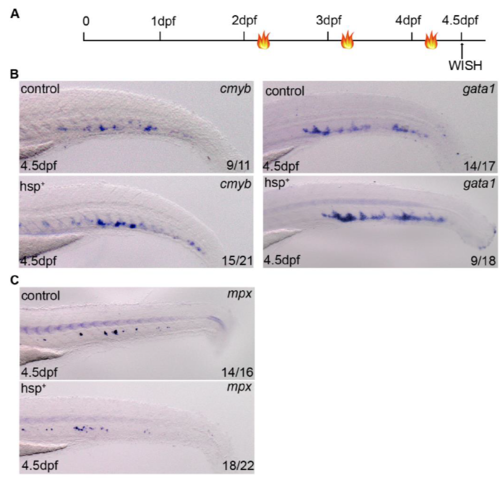
Definitive hematopoiesis is slightly affected by bif1 overexpression. A. Experimental outline of the overexpression of bif1 by heat shock at 38°C during 45 minutes (flames). B. WISH against cmyb and gata1 at 4.5dpf in control or Tg(Hsp70:bif1-p2a-tfp) embryos. C. WISH against mpx at 4.5dpf in control or Tg(Hsp70:bif1-p2a-tfp) embryos. |

ZFIN is incorporating published figure images and captions as part of an ongoing project. Figures from some publications have not yet been curated, or are not available for display because of copyright restrictions. |
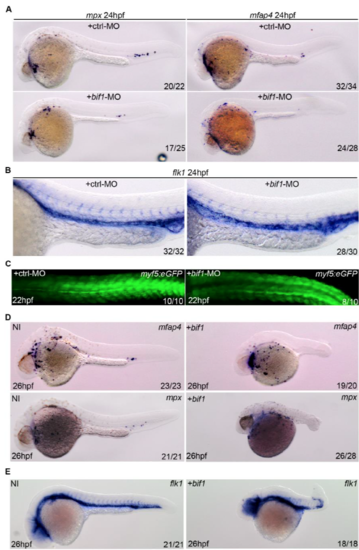
Primitive myelopoiesis and vasculogenesis are not affected in bif1-morphants. A. WISH against mpx and mfap4 at 24hpf in embryos injected with ctrl-MO or bif1-MO. B. WISH against flk1 in embryos injected with ctrl-MO or bif1-MO. C. Pictures of the tail region of Tg(myf5:eGFP) embryos, at 22hpf, injected with ctrl-MO or bif1-MO. D. WISH against mpx and mfap4 at 24hpf in embryos injected with bif1 mRNA. E. WISH against flk1 in embryos injected or not with bif1 mRNA. |
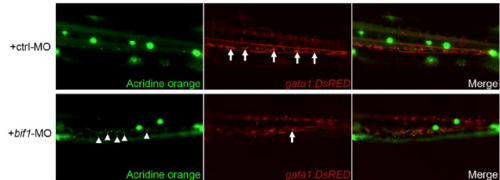
bif1 is important for cell-survival in the CHT. Acridine orange assay at 4dpf embryos (Zoom on the CHT region). These embryos were injected with a control morpholino or a morpholino against bif1. White arrows show gata1-positive cells present in the CHT. White arrowheads represent acridine orange-positive cells |
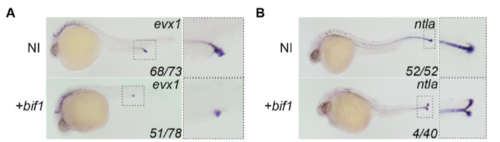
bif1 alters cloaca development and initiates the formation of an ectopic tail. (A) WISH of evx1, expressed in the cloaca and (B) ntla, expressed in the notochord, at 23hpf. Enlarged images on the right represent the region indicated by dashed outline box. |
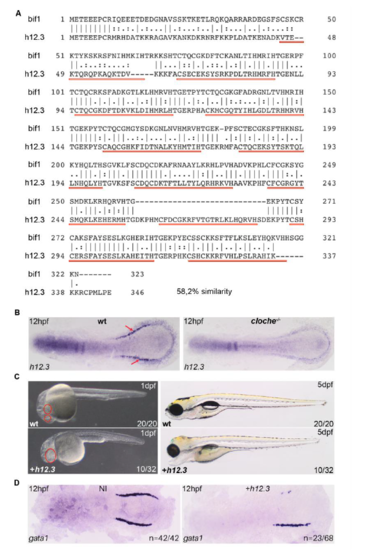
si:ch73-299h12.3, a paralogue of bif1, induces cyclopia but not dorsalization. A. Protein alignment between bif1 and si:ch73-299h12.3 (h12.3). The protein similarity is 58,2%. The red lines represent the C2H2 domains of bif1. B. h12.3 is, similar to bif1, expressed and in the posterior LPM and its expression is lost in cloche mutant. C. Bright field pictures of embryos, at 1dpf and 5dpf, injected or not with h12.3 mRNA. Red circles mark the eyes; in h12.3-injected embryos, only one cyclopic eye is formed. D. WISH against gata1 at 12hpf in embryos injected with h12.3 EXPRESSION / LABELING:
PHENOTYPE:
|
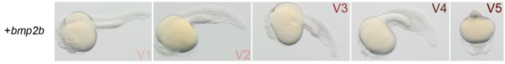
Ventralization effect of bmp2b. Ventralized morphology in 24hpf embryos injected with bmp2b mRNA. The embryos have been classified following five categories by order of severity (V1 to V5). |
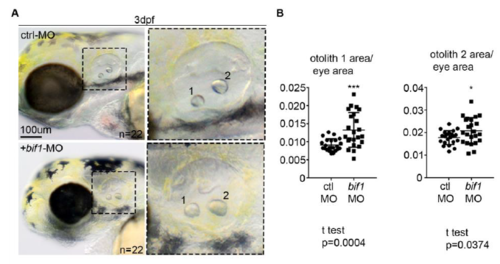
The eye phenotype in bif1-morphants is not due to a developmental delay. A. Bright field pictures of the head region of embryos injected with the control morpholino or bif1-MO. Enlarged images on the right represent the region indicated by dashed outline box. B. Quantification of otholiths area related to eyes area. Statistical analysis was completed using an un-paired Student t test. Data represents mean ± SEM *P < 0.05, ± SEM ***P < 0.001. |
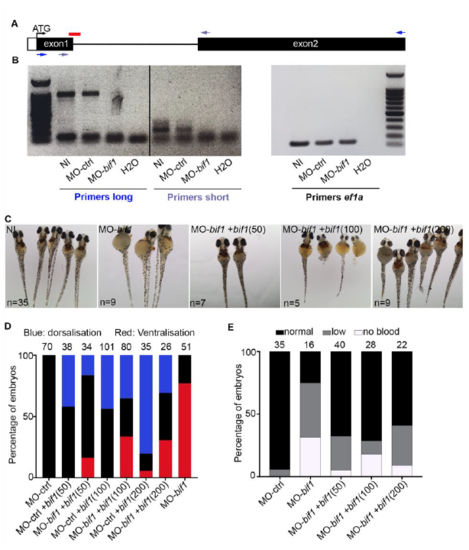
bif1 knockdown is rescued by co-injection with bif1 mRNA. A. Schematic representation of the genomic structure of bif1. The red line corresponds to the morpholino-targeted site. Dark and light blue arrows correspond to the primers amplifying a long (972 nucleotides) and a short product (224 nucleotides), respectively. The size of the intron is 1122 nucleotides. B. PCR on cDNA obtained from embryos at 24hpf, injected with MO-control or MO-bif1, or non-injected. In bif1-morphants, the wild-type band disappears, suggesting retention of the intron. C. Bright-field pictures of embryos at 3dpf stained with O-dianisidine. D. Quantification of embryos exhibiting the corresponding morphologies, dorsalization and ventralization (smaller eyes) at 3dpf. The numbers of embryos are indicated in parentheses. E. Quantification of embryos after O-dianisidine staining at 3dpf. |
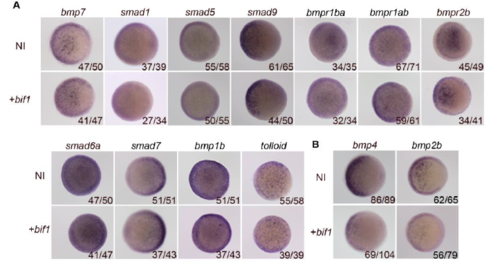
bif1 alters bmp2b and bmp4 expression. A. WISH on 6hpf embryos injected with bif1 mRNA compared to control non-injected embryos (wild-type). We tested the following probes: bmp7, smad1, smad5, smad9, bmpr1ba, bmpr1ab, bmpr2b, smad6, smad7, bmp1b, tolloid. B. WISH on 6hpf embryos against bmp4 and bmp2b injected with bif1 compared to control embryos (wild-type). |