
- Title
-
The zebrafish orthologue of the human hepatocerebral disease gene MPV17 plays pleiotropic roles in mitochondria
- Authors
- Martorano, L., Peron, M., Laquatra, C., Lidron, E., Facchinello, N., Meneghetti, G., Tiso, N., Rasola, A., Ghezzi, D., Argenton, F.
- Source
- Full text @ Dis. Model. Mech.
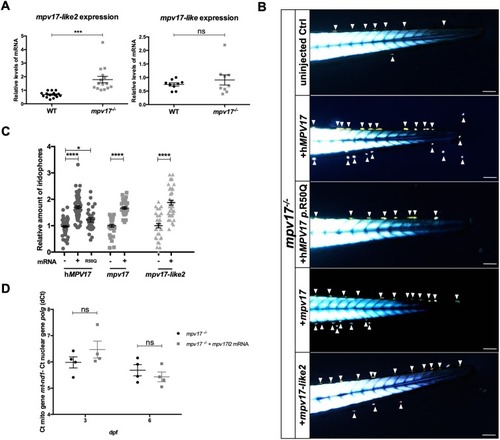
Investigation of mpv17 orthologue and paralogue genes in zebrafish larvae. (A) Real-time PCR quantification of mRNA transcripts of mpv17-like2 and mpv17-like at 6 dpf (n=9). (B) Evaluation of phenotypic rescue in the tail region at 3 dpf after the injection of human MPV17mRNAs, wild-type (WT) and p.R50Q mutated forms, and zebrafish mpv17 and mpv17-like2mRNAs. Arrowheads point to iridophores. Scale bars: 100 µm. (C) Relative quantification of iridophore amount in controls and injected larvae (n=30). (D) mtDNA copy number analysis in mpv17−/− mutants transiently overexpressing mpv17-like2 at 3 dpf and 6 dpf. Mean dCt values were calculated as Ct of mt-nd1 (mitochondrially encoded gene) minus Ct of polg (nuclear gene) (n=4). Statistical analyses were performed using two-tailed Student's t-test. Statistical significance was evaluated by setting a confidence interval of 95%; data are mean±s.e.m. ****P<0.0001; ***P<0.001; *P<0.05; ns, not significant. Experiments were performed in biological replicates. |
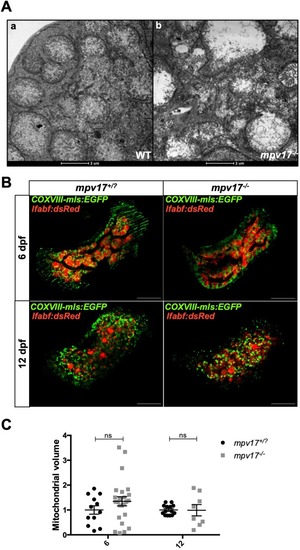
Analysis of mitochondrial ultrastructure and volume in mpv17−/− and wild-type liver at 6 dpf. (A) TEM analysis of wild-type (a) and mpv17−/− liver hepatocytes (b) (n=3). Scale bars: 2 µM. (B) Confocal images of double Tg(COXVIII-mls:EGFP); Tg(lfabp:dsRed) mpv17+/? and mpv17−/− siblings at 6 dpf (n=13) and 12 dpf (n=8). Scale bars: 50 µm. (C) Relative quantification of integrated density. Statistical analyses were performed using two-tailed Student's t-test. Statistical significance was evaluated by setting a confidence interval of 95%; data are mean±s.e.m. ns, not significant. Experiments were performed in biological replicates. |

ZFIN is incorporating published figure images and captions as part of an ongoing project. Figures from some publications have not yet been curated, or are not available for display because of copyright restrictions. |
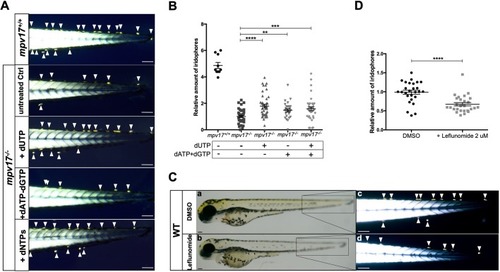
Investigation of dNTP metabolism in zebrafish larvae. (A) Visualization of iridophores in the tail region of 3 dpf larvae treated with different mixtures of dNTPs. (B) Relative quantification of iridophore number (n=27). (C) Wild-type embryos were treated with dimethyl sulfoxide and 2 μM leflunomide, inhibitor of pyrimidine biosynthesis. Whole-body bright-field pictures (a,b) and birefringent images of the tail region (c,d) are shown. (D) Quantification of relative amounts of iridophores (n=27). Arrowheads point to iridophores. Scale bars: 100 µm. Statistical analyses were performed using two-tailed Student's t-test. Statistical significance was evaluated by setting a confidence interval of 95%; data are mean±s.e.m. ****P<0.0001; ***P<0.001; **P<0.01. Experiments were performed in biological replicates. PHENOTYPE:
|
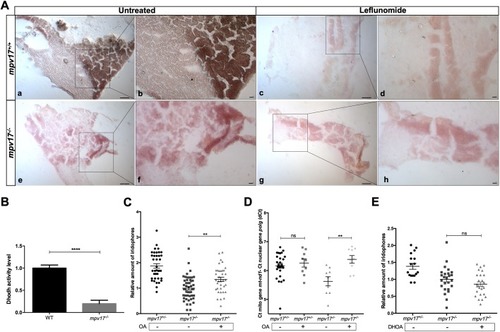
Analysis of the link between Dhodh functionality and the mpv17 KO phenotype.(A) Histochemical Dhodh assay on cryosections of adult wild-type (a-d) and mpv17 KO (e-h) liver. The activity assay was performed on the same slide and a reaction mix containing 100 μM leflunomide was used as negative control (c,d,g,h). Pictures were taken at lower (a,c,e,g) and higher (b,d,f,h) magnification. Scale bars: 100 µm (n=3). (B) Dhodh biochemical assay in 6 dpf larvae. Dhodh was assessed in zebrafish homogenized through spectrophotometric recordings following the reduction of 2,6-dichlorophenolindophenol (DCPIP). Specific Dhodh activity was obtained by subtracting the leflunomide-independent fraction and measured as nmol/min per mg of protein. Values were then normalized with respect to wild-type controls. Statistical analysis was performed using paired Student's t-test (n=3). (C,D) Relative quantification of iridophore amount in 3 dpf larvae treated with 1 μM orotic acid (OA) (n=36) (C) and mtDNA copy number analysis (n=8) (D). (E) Relative evaluation of iridophore number in 3 dpf larvae treated with 100 μM dihydroorotic acid (DHOA) (n=17). Statistical analyses were performed using two-tailed Student's t-test. Statistical significance was evaluated by setting a confidence interval of 95%; data are mean±s.e.m. ****P<0.0001; **P<0.01; ns, not significant. Experiments were performed in biological replicates. PHENOTYPE:
|
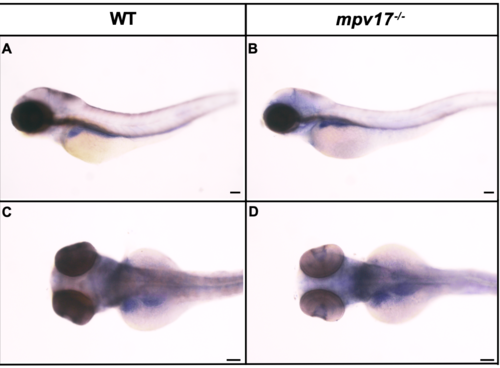
Expression analysis of zebrafish mpv17-l2 gene in wild-type and mpv17-/- mutant larvae at 3 dpf. Lateral (A-B) and dorsal (C-D) view of WISH with anti-mpv17l2 probe on 3 dpf wild-type and mpv17-/- larvae. Bars, 100 μm. EXPRESSION / LABELING:
|
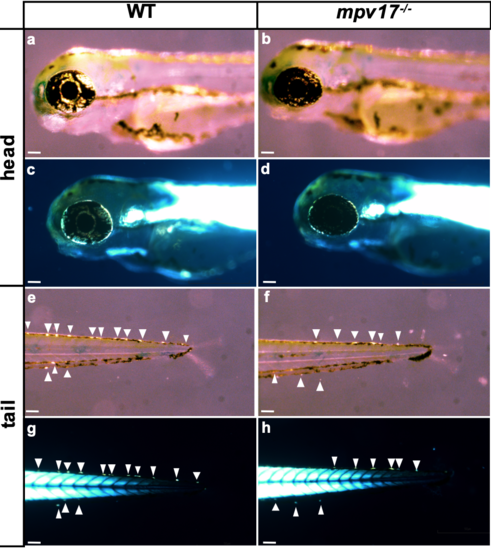
Comparison between different counting methods of iridophores in wild-type and mpv17-/- larvae at 3 dpf. Bright-field pictures (a, b, e, f), acquired according to Krauss and colleagues’ method: the angle of illumination had been adjusted individually to allow optimal visualization of iridophores (Krauss et al., 2013). Birefringence images (c, d, g, h), acquired by using a polarizer and an analyser lens, according to previously published methods (Smith et al., 2013). Representative images of iridophores along the tail (g, h) or off the eye (c, d) were taken without the need of modifying the incident light and by completely abolishing background. The arrows point to iridophores. Bars, 100 μm. |
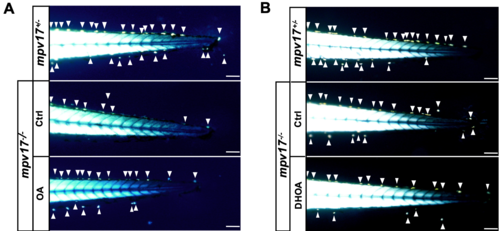
Administration of pyrimidine precursors to mpv17 heterozygous and homozygous mutants and evaluation of iridophore phenotype at 3 dpf. Tail region birefringent image of 3 dpf larvae treated with 1 μM OA (A) and 100 μM DHOA (B). The arrows point to iridophores. Bars, 100 μm. PHENOTYPE:
|