
- Title
-
Multi-sample SPIM image acquisition, processing and analysis of vascular growth in zebrafish
- Authors
- Daetwyler, S., Günther, U., Modes, C.D., Harrington, K., Huisken, J.
- Source
- Full text @ Development
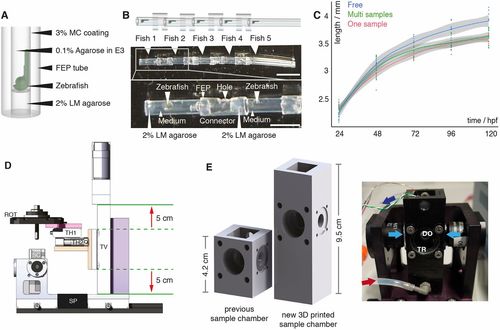
Multi-sample embedding and necessary microscope modifications. (A) Schematic of single zebrafish embryo embedding in a fluorinated polypropylene (FEP) tube using 2% low melting point (LM) agarose as a plug, 0.1% agarose in E3 as the medium and 3% methylcellulose (MC) for coating the FEP tube, as described previously (Kaufmann et al., 2012). (B) Schematic (top) and images (middle) of five mounted zebrafish (white arrowheads) in FEP tube pieces assembled using FEP connectors. The bottom image shows details of the embedding: zebrafish mounted in the FEP tubes rested on a 2% LM agarose plug and were embedded in E3 medium containing 0.1% agarose. FEP tubes containing a single zebrafish embryo were attached with FEP connectors containing a hole. Scale bar: 1 cm (top image); 4 mm (bottom image). (C) Growth curve of freely swimming fish (blue, n=8), individually embedded samples (red, n=10) and samples embedded in the multi-sample tube (green, n=9) with the 0.95% confidence interval of Loess interpolation in grey. (D) The new translational stage design of the multi-sample imaging platform ensured a vertical travel range of 10 cm (red arrows) and was built with custom-made parts, e.g. an adapter (pink) between the rotational stage (ROT) and the translational stage platform, an adapter (orange) between the horizontal translational stages (TH1 and TH2) and the vertical translational stage (TV), and a stage mount (purple). SP, spacer; SC, sample chamber. (E) Comparison of a traditional one-sample SPIM chamber with the new 3D-printed sample chamber and a picture of the new sample chamber connected to a perfusion system with inflow (red arrow) and outflow (dark blue arrow), the two illumination objectives for dual-sided illumination (light-blue arrows), a window for transmission (TR), and a detection objective (DO) in the back. |
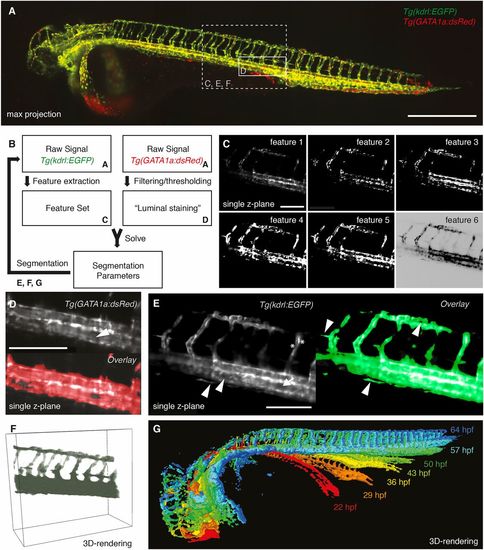
Segmentation of the vascular data. (A) Maximum intensity projection of a zebrafish expressing the endothelial marker Tg(kdrl:EGFP) in green and the red blood cell marker Tg(GATA1a:dsRED) in red with boxes depicting selected regions shown in C-F. Scale bar: 500 µm. (B) Schematic of the segmentation process with references to the corresponding figure panels (A,C-G). For successful segmentation, the imagery data of two channels was required: the raw data of the vascular marker Tg(kdrl:EGFP) and of the red blood cell marker Tg(GATA1a:dsRed) (A). (C) From the vascular marker, a feature set (C) was extracted. By filtering and thresholding the images of the red blood cell marker, a proxy for a luminal staining was established. The weights for the different features (segmentation parameters) were then calculated by using the luminal proxy as ground truth in a machine learning-based approach. With the obtained feature weights, the segmentation of the vascular channel was achieved. Features extracted from the endothelial marker Tg(kdrl:EGFP) included the raw signal (feature 1), gradient x (feature 2), gradient y (feature 3), gradient z (feature 4), total gradient (feature 5) and the inverse gradient weighted raw image (feature 6). Scale bar: 150 µm. (D) Single plane of a 3D stack of the red blood cell marker Tg(GATA1a:dsRED) (top). As the red blood cells circulate in the vasculature, the interior of vessels was also filled with fluorescent signal (white arrowhead). Therefore, filtering and thresholding of the red blood cell marker raw signal (top) provided a ground truth (bottom, red) of signal inside the vasculature from which the segmentation parameters could be calculated. Scale bar: 150 µm. (E) Single plane of a 3D stack of the endothelial marker (left) highlighting the challenges of vascular segmentation: hollow tubes (arrow), intensity differences (asterisks) and small vessels next to a large vessel (arrowheads). Using our segmentation approach (right), even fine structures of the vasculature were segmented correctly (arrowheads). Scale bar: 150 µm. (F) 3D rendering of the selected region with the segmentation in green. (G) 3D rendering of the segmentations at different time points of development. |
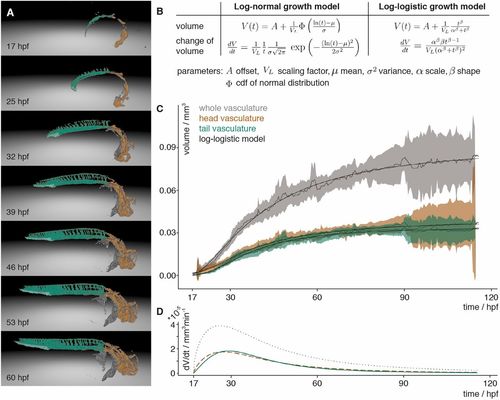
Vascular volume growth characteristics of zebrafish. (A) Segmentation of the vasculature at seven different time points labelled with the annotation of the head (orange) and tail (turquoise) with its caudal vein plexus (light turquoise) and the rest of the segmented vasculature (grey). (B) Equations of the scaled cumulative log-logistic and log-normal growth models describing the volume V(t) and change of volume dV/dt over time t with offset A, scaling factor VL, mean µ and standard deviation σ of log-normal distribution and cumulative distribution function (cdf) Φ of the standard normal distribution, and log-logistic scale parameter α and shape parameter β. (C) Experimental measurements of the volume over time of the whole vasculature (grey), and the head (brown) and tail (turquoise) vasculature. The mean of the measurements is depicted with a solid line and the 95% confidence interval (t-statistics, n=7) as a ribbon in the corresponding colour. The black line depicts the approximation of the volume calculated using the scaled cumulative log-logistic growth model. The corresponding panel for the scaled cumulative log-normal model is in Fig. S10A. (D) The volume growth rate of the whole vasculature (grey, dotted), and head (brown, dashed) and tail (turquoise) vasculature was calculated by inserting the parameters obtained from the approximation into the change of volume equation of the scaled log-logistic growth model. The corresponding panel for the scaled log-normal model is in Fig. S10B. |
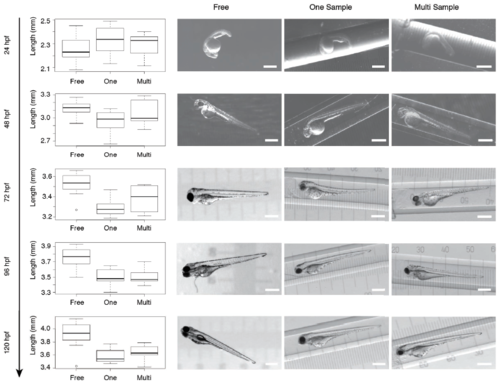
Multi-sample embedding Distribution of the body length of freely swimming fish (n=8), single embedded samples (n=10),and samples embedded in the multi-sample tube (n=9) with representitive images for each embedding. The fish were embedded at 24 hpf. No morphological defects were observed with all three embedding protocols. |
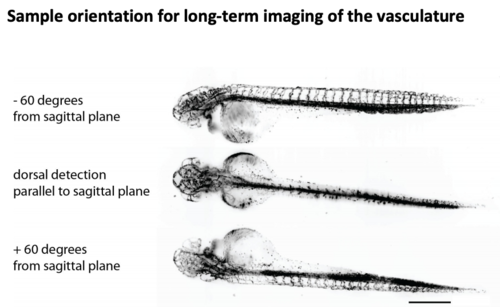
Imaging directions of zebrafish |
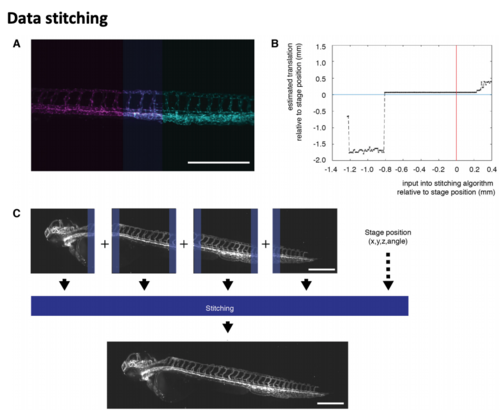
Combining multiple acquisition volumes into one image: data stitching (A) Stitching of two images (magenta and cyan) zebrafish expressing the vascular marker Tg(kdrl:EGFP) (Jin et al., 2005). The overlap between the two images is highlighted in violet. (B) To automatically calculate the stitching of the two images in (A), an initial offset was set to initilize the calculation. Varying this offset revealed that it was robust over a large range of initialization values. Nevertheless, stitching became unreliable if the value were too far off from the assumed offset given by the translation (black line) was close to the physical coordinate given by the stage position (blue line) but not exaact (0.06 mm/53 pixels away). therefore, using the stage position was a reasonable estimate for initialization. (C) In our implemebtation, the stitching generated a final outputimage. Here, a zebrafiah expressing the vascular marker Tg(kdrl:Hsa.HRASmCherry) (Chi et al., 2008) is shown. |
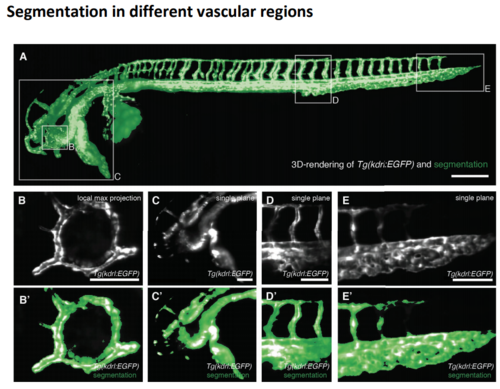
Segmentation in different regions of the fish at around 2.5 dpf (A) 3D rendering of the raw signa; of the vascular marker Tg(kdrl:EGFP) (gray) overlaid with the segmentation obtained by our novel segmentation approach (green) with boxes depicting selected regions shown in (B-E, B'-E'). Scale bar: 0.25 mm. (B, B') Vascular marker (top) and overlay with segmentation (botto) of a local maximum intensity projection over an 80 um deep 3D volume revealed the segmentation of the vasculature ring in the eye of zebrafish. Scale bar: 0.1 mm. (E, E') Vascular marker (top) and overlay with segmentation (bottom of a single plane from a 3D volume revealed the segmentation quality at the end of the tail of the zebrafish. Scale bar: 0.1 mm. |
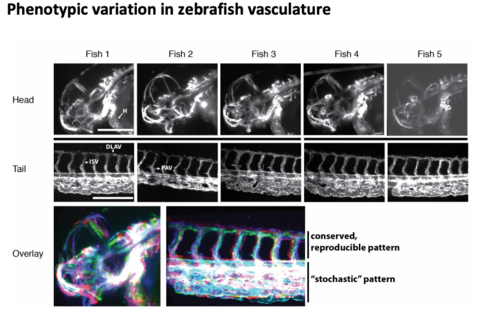
Phenotypic variation of zebrafish vasculature Five zebrafish expressing the vasculature marker Tg(kdrl:lifeactGFP) (Vanhollebeke et al., 2015) at 35 hpf were imaged using SPIM. Maximum projections f the head and tail of five different individual zebrafish embryos (H, heart; DLAV, dorsal longitudinal anastomotic vessel; ISV, intersegmental vessels; PAV, parachordal vessel). Scale bar: 0.25 mm. Overlay of the head and the tail parts revealed different degrees of variation in the vasculature. The bright white signal indicates maximum overlap. |
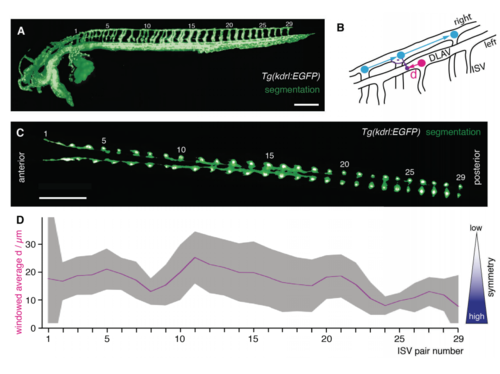
Quantification of symmetry of intersegmental vessel (ISV) pairs along the anterior-posterior axis at around 2.5 dpf (A) 3D rendering of the raw signal of the vascular marker Tg(kdrl:EGFP) (gray) overlaid with the segmentation obtained by our novel segmentation approach (green). The ISV pairs along the anterior-posterior axis were numbered (1-29). Scale barP 0.25mm. (B) Schematic of the quantification of symmetry of ISV pairs. For each ISV of the right side (cyan circles) the corresponding closest ISV of the left side (magenta circle) was determined. The symmetry was measured as absolute value of the distance d of the intersection (purple circle) with the ISV position of the closest left ISV (magenta circle). The intersection (purple circle) was calculated as point where the vector originating at the right ISV position with an angle of 90 degrees to the right DLAV (purple vector) met. (C) Single slice from 3D stack imaged from the dorsal direction revealed the arrangement of the ISVs pairs numbered 1-29. In this slice, the raw signal of the vascular marker Tg(kdrl:EGF) (gray) was overlaid with the segmentation (green). Scale bar: 0.25 mm. (D) Result of the quantification of symmetry d from 3 fish. To decrease noise in the calculation, the value of the distance d was indicated as windowed average over the neighboring ISV pairs, i.e. n=9 (3 fish and 3 ISV pairs/data point) except for the ISV pair 1 and 29 where n=6 (3 fish, 2 ISV pairs). The average value was indicated as solid magenta line with the 95% confidence interval (t-statistics, n=9 [ISV pair 2-28], n=6 [ISV pair 1 and 29]) as a ribbon in gray. |