
- Title
-
Programmed conversion of hypertrophic chondrocytes into osteoblasts and marrow adipocytes within zebrafish bones
- Authors
- Giovannone, D., Paul, S., Schindler, S., Arata, C., Farmer, D.T., Patel, P., Smeeton, J., Crump, J.G.
- Source
- Full text @ Elife
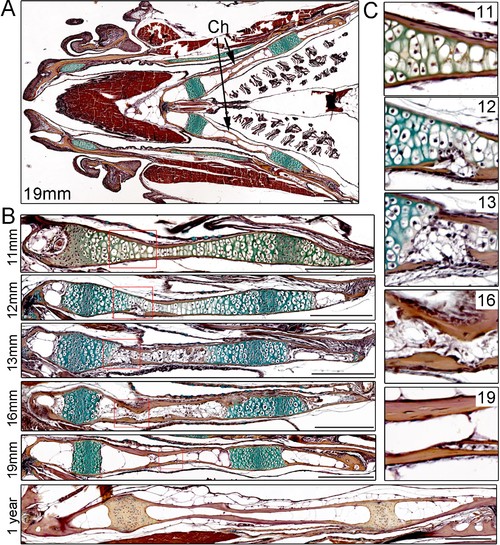
Time-course of Ch remodeling in juvenile zebrafish.(A) Pentachrome staining of a longitudinal section through the head of a 19 mm fish. The jaw is toward the left (anterior) and the gills toward the right (posterior). The green stain highlights the collagen matrix of cartilage, and the reddish-brown stain the mineralized matrix of bone. The bilateral set of Ch bones is indicated. n = 3. (B) High magnification views of the Ch at successive stages show the gradual replacement of chondrocytes in the central shaft and at each end with adipocytes (which appear white due to loss of lipid during processing). n = 3 for each stage. (C) Higher magnification views of the boxed regions in (B). Cortical bone appears reddish-brown. Note the breaks in cortical bone toward the lower part of the images at 12 and 13 mm, which are largely resolved by 16 and 19 mm. Scale bars = 50 μM. |
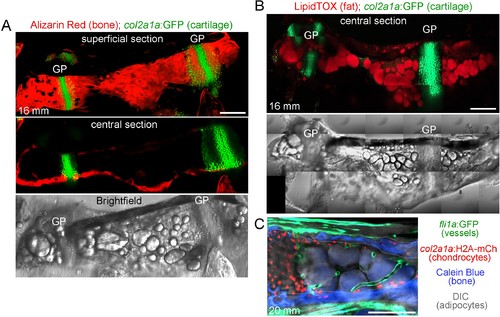
Ch bone and marrow fat structure.(A) Dissected Ch bone from a juvenile zebrafish (16 mm SL) shows staining of cartilage cells by col2a1a:GFP (green) and mineralized bone matrix by Alizarin Red. A superficial confocal section shows cortical bone along the length of the Ch, and a central section shows a lack of bone inside the Ch. Brightfield image of the same Ch shows large lipid droplets characteristic of marrow adipocytes. GP, growth plate. (B) Confocal projection of a dissected Ch (16 mm SL) from a col2a1a:GFP animal shows cartilage in green and adipocytes stained with LipidTOX in red. Brightfield image of the same Ch shows large lipid droplets overlapping with LipidTOX signal. n = 2. Scale bars = 100 μm. (C) Confocal section from a double transgenic animal (20 mm SL) shows fli1a:GFP+ blood vessels (green), col2a1a:H2A:mCherry-2A-GFPCAAX+ chondrocytes (red nuclei), Calcein Blue+ cortical bone (blue, outlined in white), and adipocytes (brightfield, grey). Note the cross-sectional and longitudinal slices through the blood vessels in the central portion of the marrow cavity (to the right of the chondrocytes and between the cortical bone). Scale bars = 100 μm (A,B), 50 μm (C). |
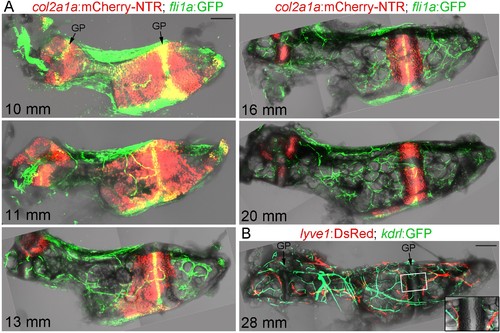
Vascularization of the Ch.(A) Confocal projections of dissected Ch bones at five successive stages. Merged fluorescent and brightfield channels show the gradual replacement of the cartilage with a fat-filled core. col2a1a:mCherry-NTR highlights chondrocytes that become increasingly restricted to two growth plates (GP) at either end of the bone. fli1a:GFP labels endothelial cells and chondrocytes located in the central portions of the growth plates. Vascularization of the Ch increases over time. n = 2 at each stage. (B) Confocal projection shows networks of kdrl:GFP+ vascular endothelial and lyve1:DsRed+ lymphatic endothelial cells within an adult Ch bone. The inset shows a single confocal section through the boxed portion of the growth plate, with both blood and lymphatic vessels abutting the edges but not penetrating into the growth plate. n = 2. Scale bars = 100 μm (A) and 200 μm (B). EXPRESSION / LABELING:
|
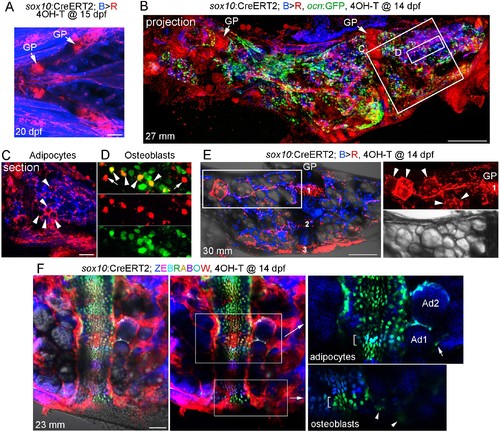
Contribution of sox10+ chondrocytes to osteoblasts and marrow adipocytes.(A) Confocal projection of a sox10:CreERT2; bactin2:tagBFP>DsRed animal treated at 15 dpf with 4-OHT and imaged at 20 dpf. A ventral view of the lower face shows conversion in growth plate (GP) Ch chondrocytes, as well as additional mesenchymal cells throughout the face. n = 3. (B) Confocal projection of a dissected Ch bone from a sox10:CreERT2; bactin2:tagBFP>DsRed; ocn:GFP animal converted at 14 dpf and imaged as an adult (27 mm SL). In addition to labeling of the growth plates, extensive DsRed+ cells are seen throughout the Ch in 3/3 strongly converted animals. (C) Higher magnification confocal section through the boxed region in (B) shows a subset of adipocytes labeled by DsRed (red, arrowheads). (D) Higher magnification confocal section through the boxed region in (B) shows a mixture of converted (yellow, arrowheads) and unconverted (green) ocn:GFP + osteoblasts, as well as converted ocn:GFP- mesenchymal cells (red, arrows). (E) Confocal projection of a dissected Ch bone from a sox10:CreERT2; bactin2:tagBFP >DsRed animal converted at 14 dpf and imaged as an adult (30 mm SL). Three prominent clones in the growth plate are numbered. In the boxed regions to the right, a discrete clone of growth plate chondrocytes transitions into a stream of mesenchymal cells and then a number of adipocytes (arrowheads). The brightfield image from the same sample (below) shows the lipid vesicles characteristic of adipocytes. Similar clonal contributions were seen in four independently converted animals. (F) Confocal projection of a portion of a dissected Ch growth plate from a sox10:CreERT2; Zebrabow animal converted at 14 dpf and imaged as an adult (23 mm SL). Images are shown with and without the Nomarski channel. Unconverted cells are red, and distinctly colored growth plate clones are visible. Magnified images corresponding to the boxed regions are shown without the red channel to highlight distinct green and teal clones (brackets). The teal clone of growth plate chondrocytes is contiguous with two similarly colored adipocytes (Ad1, Ad2), and the green clone is contiguous with faintly green cells (arrowheads) in cortical bone. In the adipocyte clone, the arrow indicates a green marrow cell distinct from the teal-colored adipocytes. Comparable clonal contributions were seen in three independently converted animals. Scale bars = 100 μm (A), 200 μm (B,E,F), 50 μm (C). EXPRESSION / LABELING:
|
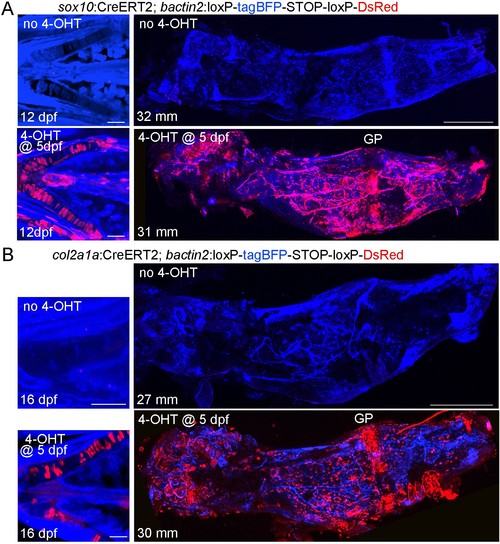
Characterization of the sox10:CreERT2 and col2a1a:CreERT2 transgenic lines.(A) Confocal projections of sox10:CreERT2; bactin2:loxP-tagBFP-stop-loxP-DsRed animals treated with or without 4-OHT at five dpf. At 12 dpf, labeling (red) is seen in Ch chondrocytes and some additional cells in the face. In the adult dissected Ch (31–32 mm SL), labeling is seen in the growth plate (GP) and throughout the bone. No labeling is seen in the absence of 4-OHT. n = 4 for each treatment. (B) Confocal projections of col2a1a:CreERT2; bactin2:loxP-tagBFP-stop-loxP-DsRed animals treated with or without 4-OHT at five dpf and then re-imaged. At 16 dpf, labeling (red) is seen only in chondrocytes (shown here for the Ch cartilages). In the adult dissected Ch (27–30 mm SL), labeling is seen in growth plate cartilage and throughout the Ch bone. No labeling is seen in the absence of 4-OHT. n = 4 for each treatment.. Scale bars = 50 μm (12–16 dpf), 400 μm (adults). |
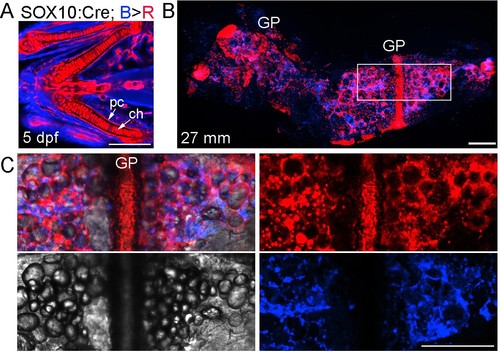
Neural crest contributions to the Ch bone and marrow adipocytes.(A) In SOX10:Cre; bactin2:loxP-tagBFP-stop-loxP-DsRed animals, the human SOX10 promoter drives Cre expression and subsequent recombination of tagBFP (blue) to DsRed (red) in neural crest lineage cells (as opposed to the zebrafish sox10 promoter of Figure 3, which has additional later expression throughout chondrocytes of both crest and mesoderm origin). Confocal projection of a zebrafish embryo (five dpf) shows nearly all of the chondrocytes (ch) and perichondral cells (pc) are labeled red. n = 4. (B) Confocal projection of a dissected Ch bone from an adult zebrafish (27 mm SL). Nearly all growth plate (GP) chondrocytes are labeled red and numerous red lineage cells are seen throughout the marrow cavity and along the cortical surface. n = 4. (C) Merged and separate channels corresponding to the boxed region in (B), which is centered on the growth plate. The brightfield channel shows the many lipid droplets characteristic of adipocytes. The red channel shows the circular profile of the cytoplasm surrounding the lipid droplets in labeled adipocytes, as well as numerous smaller mesenchymal cells, some of which are likely osteoblasts on the cortical surface. The blue channel shows the presence of cells of non-neural-crest-origin, such as endothelial cells of mesoderm origin that form the vasculature within Ch (see Figure 2). Similar contributions were observed in four independent animals. Scale bars = 50 μm (A), 200 μm (B,C). |
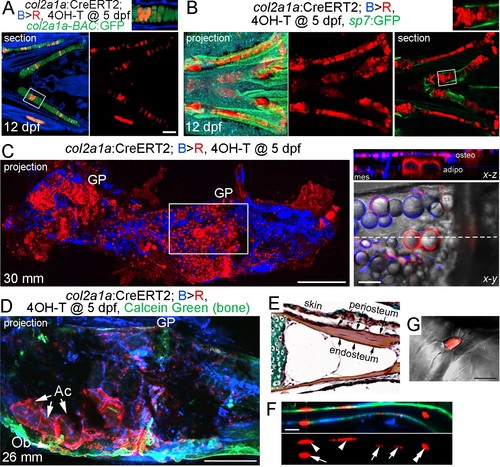
Contribution of col2a1a+ chondrocytes to osteoblasts and marrow adipocytes.(A, B) Ventral views of col2a1a:CreERT2; bactin2:tagBFP >DsRed animals treated at 5 dpf with 4-OHT and imaged at 12 dpf. Confocal sections and projections as indicated demonstrate specific conversion (red) throughout cartilage, as shown by co-localization with the chondrocyte-specific marker col2a1a-BAC:GFP (A) and lack of co-localization with the osteoblast and periosteum marker sp7:GFP (B). Boxed areas are magnified in the top right insets. n = 6 for each. (C) After conversion of col2a1a:CreERT2; bactin2:tagBFP>DsRed animals at five dpf, a confocal projection through the dissected Ch of an adult (30 mm SL) shows extensive DsRed+ cells in the growth plates (GP) and throughout the bone. A higher magnification view of the boxed region, along with brightfield, shows DsRed fluorescence in the thin cytoplasm surrounding the prominent lipid vesicles indicative of marrow adipocytes, as well as in osteoblasts (osteo) of cortical bone and mesenchymal cells (mes) within the marrow cavity. The dashed line in the x-y slice shows the position of the x-z slice above. n = 10. (D) In this example of a col2a1a:CreERT2; bactin2:tagBFP>DsRed animal converted at five dpf and imaged as an adult, a prominent clone of DsRed+ cells are evident at the bottom of the growth plate, consisting of GP chondrocytes, adipocytes (Ac), and osteoblasts (Ob) associated with Calcein Green+ cortical bone. Similar clonal contributions were seen in four independently converted animals. (E) Pentachrome staining of a portion of the Ch growth plate at 19 mm SL shows the endosteum and periosteum. Note that zebrafish have osteocytes embedded in their cortical bone (the dark nuclei in the reddish-brown matrix). (F, G) High-magnification images of a section of Ch cortical bone from an animal converted at five dpf and imaged at 28 mm SL. DsRed+ osteoblasts/osteocytes are seen in the endosteal surface (arrows), periosteal surface (arrowheads), and embedded in bone (double arrowhead). The merged brightfield and fluorescence image from a different example (G) shows a DsRed+ cell with cellular processes characteristic of osteocytes. Scale bars = 100 μm (A,B), 200 μm (C,D), 50 μm (F), 20 μm (G). EXPRESSION / LABELING:
|
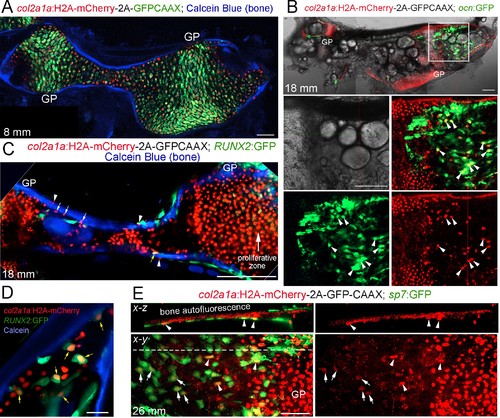
Tracing of col2a1a-lineage cells by a long-lived Histone2A-mCherry fusion protein.(A) At a stage preceding growth plate remodeling (8 mm SL), col2a1a:H2A-mCherry-2A-GFPCAAX labels chondrocytes, but not osteoblasts associated with Calcein Blue+ mineralized bone.rowth plate (GP) chondrocytes co-express the nuclear Histone2A-mCherry protein (red) and the membrane-localized GFPCAAX protein (green). In the middle and poles of Ch, hypertrophic chondrocytes retain the long-lived H2A-mCherry protein but not the short-lived GFPCAAX protein, reflective of the down-regulation of col2a1a expression during hypertrophic maturation. n = 3. (B) In a confocal section through the dissected Ch of a juvenile fish (18 mm SL), numerous H2A-mCherry+; ocn:GFP+ cells are seen in regions where the cartilage template is being converted to fat. Magnification of the boxed region shows the brightfield image (white), a merged image of H2A-mCherry+ cells (red) and ocn:GFP+ cells (green), and individual channels below. We observed a number of H2A-mCherry+; ocn:GFP+ cells (arrowheads) in 4/4 animals. (C) Confocal projection of a dissected Ch at 18 mm SL reveals cells expressing nuclear Histone2A-mCherry (red) on both the endosteal surface (arrows) and periosteal surface (arrowheads) of Calcein Blue+ cortical bone. Some H2A-mCherry+ cells associated with bone also co-express the osteoprogenitor marker RUNX2:GFP (yellow arrow). Note that the membrane GFPCAAX signal from the col2a1a:H2A-mCherry-2A-GFPCAAX transgene is much weaker and barely detectable in the proliferative zone at the gain settings used to image cytoplasmic RUNX2:GFP. n = 3. (D) Confocal section through the Ch at higher magnification shows several H2A-mCherry+; RUNX2:GFP+ cells (yellow arrows) in the marrow cavity and close to the endosteal surface of the Calcein Blue+ bone. (E) In adult fish (26 mm SL), several H2A-mCherry+ cells are found to co-express the osteoblast marker sp7:GFP on the endosteal surface. H2A-mCherry tends to be stronger closer to the growth plate; arrowheads denote stronger and arrows denote weaker H2A-mCherry signal. The white dotted line in the x-y section shows the location of the x-z section above. n = 5. Scale bars = 50 μm (A,D,E), 100 μm (B,C). EXPRESSION / LABELING:
|
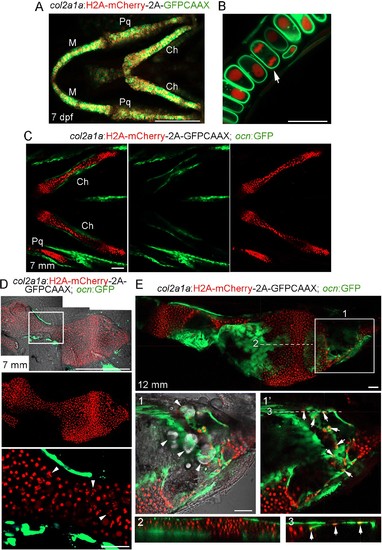
Characterization of the col2a1a:Histone2A-mCherry-2A-GFPCAAX line.(A) Confocal projection from a ventral view shows that the majority of chondrocytes co-express nuclear H2A-mCherry (red) and membrane GFPCAAX (green) in the facial cartilages of col2a1a:H2A-mCherry-2A-GFPCAAX fish at seven dpf. Note the lack of fluorescent signal outside cartilage, demonstrating specificity. M, lower jaw Meckel’s cartilage; Pq, upper jaw palatoquadrate cartilage; Ch, ceratohyal cartilage. n = 10. (B) Magnified confocal section of a region of the M cartilage from (A) shows membrane localization of GFPCAAX (green) and nuclear localization of H2A-mCherry (red). The arrow depicts a chondrocyte in anaphase. (C) Confocal projection shows the bilateral set of Ch cartilages in col2a1a:H2A-mCherry-2A-GFPCAAX; ocn:GFP fish at 7 mm SL. Merged and individual channels show that H2A-mCherry labels chondrocytes but not ocn:GFP+ osteoblasts. The much weaker GFPCAAX signal is not apparent at the lower gain used to image ocn:GFP expression. n = 2. Scale bars = 100 μm. (D) Dissected Ch cartilage from (C) shows lack of H2A-mCherry expression in ocn:GFP+ osteoblasts in the bone collar at this stage (prior to growth plate remodeling). The boxed region is magnified below. Note the nuclear fragmentation (arrowheads) in several hypertrophic chondrocytes at this stage, suggesting that some hypertrophic chondrocytes may already be initiating a cell death program. n = 2. (E) Confocal section of a dissected Ch cartilage from a col2a1a:H2A-mCherry-2A-GFPCAAX; ocn:GFP fish at the beginning of growth plate remodeling (12 mm SL). Magnification of the boxed region (1) shows a merged image of H2A-mCherry+ cells (red), ocn:GFP+ cells (green), and the DIC channel (white). Note several lipid-filled adipocytes (arrowheads) within the distal end of the Ch bone. Removal of the DIC channel (1’) reveals several H2A-mCherry+; ocn:GFP+ cells (arrows), with a corresponding digital section through the X-Z plane (3) revealing that these double-positive cells reside on the bone surface and thus likely represent osteoblasts. In contrast, an X-Z digital section through the central shaft of the Ch bone (2) shows no double-positive cells on the cortical surface, consistent with this portion of the growth plate having not yet initiated remodeling and hence lacking chondrocyte-derived osteoblasts. n = 2. Scale bars = 50 μm (A,C,E), 20 μm (B,D). |
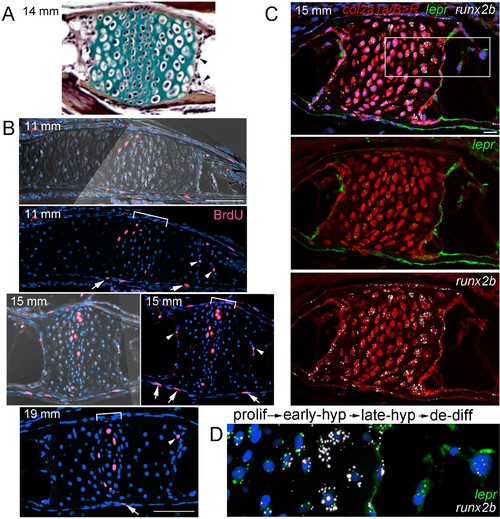
Late-stage hypertrophic chondrocytes re-enter the cell cycle and express lepr.(A) Pentachrome staining of a section through a Ch growth plate at 14 mm SL. Arrowheads denote two examples of hypertrophic chondrocytes at the edges of the growth plates that lack collagen-rich matrix (green) and appear to be exiting their lacunae. (B) BrdU incorporation (pink) relative to all nuclei (Hoechst, blue) shows recently divided cells. Fluorescent images with or without brightfield are shown for 11 and 15 mm SL stages, and fluorescent channel only for 19 mm SL. In addition to BrdU +cells in the proliferative zones of the growth plates (brackets) and perichondrium (arrows), a subset of hypertrophic chondrocytes at the edges of the growth plates (arrowheads) are BrdU+ at each stage. Proliferative hypertrophic chondrocytes were seen in sections from three independent animals at each stage. (C–D) Fluorescent RNAscope in situ hybridization for lepr (green) and the hypertrophic chondrocyte and osteoblast precursor marker runx2b (white). Red signal indicates cells derived from col2a1a/B > Rchondrocytes that were converted by addition of 4-OHT at five dpf (detected by anti-DsRed antibody), and all nuclei are shown in blue (Hoechst). In a section of a Ch growth plate at 15 mm SL, the merged channel above and red/green and red/white channels below show expression of lepr and runx2b in chondrocytes and their derivatives. In the higher magnification view of the boxed region (D), lepr is expressed in proliferative chondrocytes, runx2b is expressed at high levels and lepr at lower levels in early hypertrophic chondrocytes, and lepr and runx2b are co-expressed in late hypertrophic chondrocytes and adjacent mesenchymal cells that have been released from the growth plate. Similar expression of lepr and runx2b was seen in sections from 4/4 independent animals. Scale bars = 50 μm (B,C), 20 μm (D). EXPRESSION / LABELING:
|
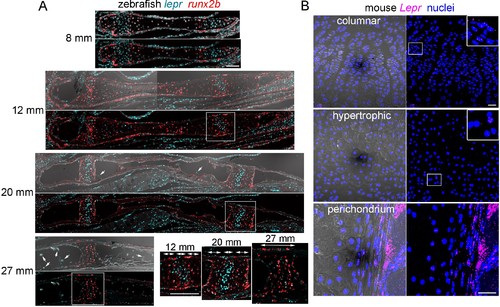
Expression of Lepr/lepr mRNA in zebrafish and mouse endochondral bone.(A) Sections through the Ch bone were processed for RNAscope in situ hybridization using probes against lepr (blue) and the hypertrophic chondrocyte and osteoblast marker runx2b (red). Images with DIC are shown above. Arrows indicate lepr +cells in the marrow. Magnifications corresponding to the boxed regions show runx2b+ hypertrophic zones flanking a central lepr+ proliferative zone within the growth plate (bidirectional arrows indicate zones). By 27 mm, a distinct lepr+ proliferative zone is no longer apparent. n = 3 for each stage. (B) Sections through the femur in 8 week old mice were processed for RNAscope in situ hybridization using a LepR probe (magenta), and counterstained with Hoechst to label nuclei (blue). Magnified regions of the growth plate show broader expression in columnar chondrocytes and only rare expression in the hypertrophic zone. Strong LepR expression is also seen within and near the perichondrium. Comparable LepR expression was observed in sections from three independent femurs. Scale bars = 50 μm. |
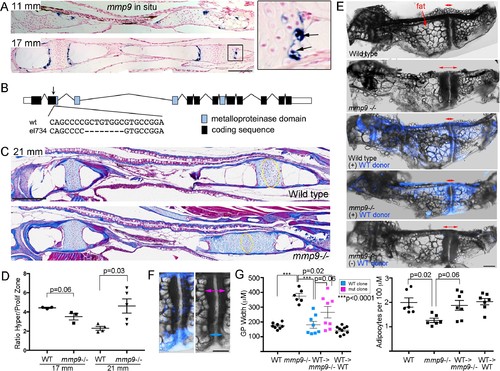
Tissue-autonomous requirement for mmp9 in cartilage remodeling.(A) Colorimetric mRNA in situ hybridization shows expression of mmp9 (blue) in sections of the Ch at 11 and 17 mm SL. Inset shows specific expression of mmp9 in hypertrophic chondrocytes (arrows) at the edge of the growth plate. Nuclear fast red was used as a counterstain. n = 2 at each stage. (B) Schematic of the mmp9 gene locus in zebrafish. Rectangles denote exons. The site of the 8 bp deletion in the el734 allele is indicated by an arrow, with specific sequence changes shown below. This frame-shift mutation is predicted to result in an early stop codon and loss of the catalytic metalloproteinase domain. (C) Trichrome staining at 21 mm SL shows enlarged growth plates in the Ch bones of mmp9 mutants. The approximate regions of the proliferative zones used for quantification in (D) are shown by the yellow ovals. (D) Quantification of the ratio of the hypertrophic to the proliferative zones shows a delay in remodeling the hypertrophic zone in mmp9 mutants at 21 but not 17 mm SL. We performed a students t-test and show standard error of the mean. (E,F) Dissected Ch bones at adult stages (27–31 mm SL) from wild-type, mmp9 mutant, and wild-type and mutant hosts receiving wild-type donor neural crest transplants (blue). Ectoderm cells from bactin2:tagBFP >DsRed donors were transplanted unilaterally into the neural crest precursor domain of unlabeled hosts at six hpf. Red two-sided arrows indicate the width of the posterior growth plates. (+) denotes sides receiving transplants, and (-) denotes contralateral control sides. The rescued growth plate from the mmp9 mutant receiving a wild-type neural crest transplant is shown at higher magnification in (F), with blue arrows showing a narrower wild-type growth plate clone and magenta arrows a wider mutant clone. (G) Quantification shows that mmp9 mutants have wider growth plates and fewer adipocytes in the marrow than wild-type siblings. Wild-type neural crest transplants rescue growth plate width in mmp9mutants, with a trend toward better rescue in areas of the growth plate with wild-type (blue) versus mutant (magenta) clones. There was also a strong trend toward rescue of adipocyte number with wild-type neural crest transplants that contributed to growth plate chondrocytes. We performed a Tukey-Kramer HSD test and show standard error of the mean. Unless indicated, all other comparisons were not significant (p > 0.05). Scale bars = 50 μm (A,C), 200 μm (E, F). See also Figure 7—source data 1. EXPRESSION / LABELING:
|