
- Title
-
CFTR Protects against Mycobacterium abscessus Infection by Fine-Tuning Host Oxidative Defenses
- Authors
- Bernut, A., Dupont, C., Ogryzko, N.V., Neyret, A., Herrmann, J.L., Floto, R.A., Renshaw, S.A., Kremer, L.
- Source
- Full text @ Cell Rep.
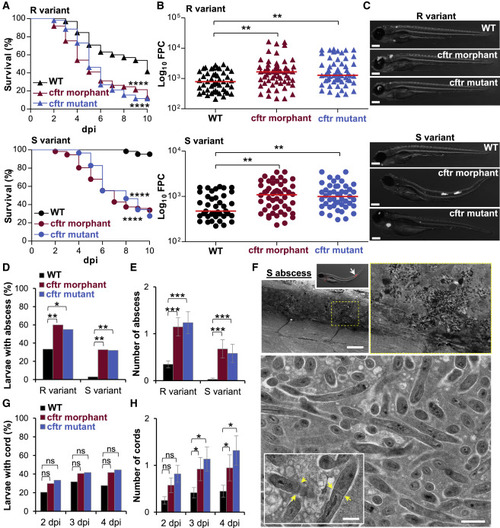
cftr Deficiency Increases Susceptibility to M. abscessus Infection (A–H) WT, cftr mutant, and cftr morphant were intravenously (i.v.) infected with either Mabs R or S expressing tdTomato. (A) Survival analysis of R-infected (top) or S-infected (bottom) larvae. Data are plotted as percentage of surviving animals over 10 days (n = 60, three experiments). (B) Mean bacterial loads as fluorescence pixel counts (FPCs; average of three independent experiments) of 3 dpi larvae infected by either Mabs R (top) or S (bottom). (C) Representative overlay fluorescence microscopy images of Mabs R-infected (top) or S-infected (bottom) larvae at 3 dpi. Scale bars, 200 μm. (D and E) Percentage of 3 dpi larvae with abscess (D) and associated mean ± SEM number of abscess per infected animal (E) (n = 45, three experiments). (F) EM showing a sagittal section through a Mabs S abscess in a cftrmorphant. Overview image of the abscess into the spinal cord (top; scale bar, 25 μm). Representative EM image of the abscess lesion with many extracellular bacterial in an area of acellular necrotic debris (bottom; scale bar, 0.5 μm). Closeup showing bacterial division, with yellow arrows indicating septum of division (scale bar, 0.5 μm). (G and H) Kinetic of Mabs R cording in whole embryos over 4 days of infection (G) and associated mean ± SEM number of cords per infected animal (H) (n = 45, three experiments). |
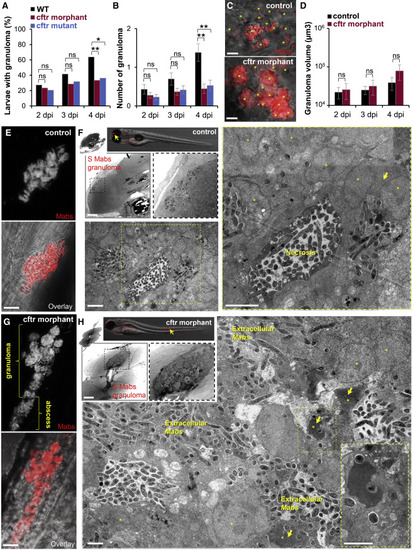
Absence of CFTR Impairs M. abscessus Infection-Mediated Granuloma Integrity and Maintenance (A–D) WT, cftr mutants, and cftr morphants were i.v. infected with the S variant of Mabs expressing tdTomato and monitored using confocal microscopy for granuloma formation, number, and size (n = 35–45; data are plotted as mean ± SEM from three experiments). (A and B) Kinetics of granuloma formation in whole embryos over 4 days of infection (A) and associated number of granuloma per animal (B). (C) Confocal images showing a representative early Mabs granuloma in 3 dpi larvae. Scale bars, 10 μm. For a similar number of infected phagocytes(asterisk) in a granuloma, the CF granuloma contains a higher bacterial burden than the WT granuloma. (D) Granuloma volume analysis in whole larvae over 4 days of infection. (E–H) Control larvae or cftr morphants infected with Mabs S expressing tdTomato observed by confocal microscopy and EM for granuloma at 4 dpi. (E and G) Representative confocal imaging of a granuloma within the spinal cord of an infected animal showing the development of a compact and organized phagocyte aggregate moderately infected in control fish (E) compared with a cftr morphant harboring a heavily loaded granuloma whose disruption leads to bacterial spread characterized by abscess formation (G). Scale bars, 10 μm. (F) EM showing a sagittal section through a WT Mabs granuloma. Overview image of granuloma (arrow) into the brain of infected WT (top; scale bar, 50 μm). Representative EM image of a compact and well-organized WT granuloma (bottom and right; processed as stitching of micrographs; scale bars, 2 μm) showing a stable mycobacterial-containing structure with a central necrotic area and a typical dense region of cellular debris and surrounded by numerous infected phagocytes (asterisk) and giant cells (arrow). (H) EM showing a sagittal section through a Mabs granuloma-like lesion in absence of CFTR. Overview image of granuloma in the spinal cord (arrow) of infected cftr morphant (top; scale bar, 25 μm). Representative EM image of a CFTR-depleted granuloma (bottom and right; processed as stitching of micrographs; scale bar, 2 μm) showing a necrotic structure with replicating bacteria and numerous dead infected phagocytes harboring a typical apoptotic nucleus (asterisk) with chromatin“superaggregation.” Most bacilli stay extracellular. |
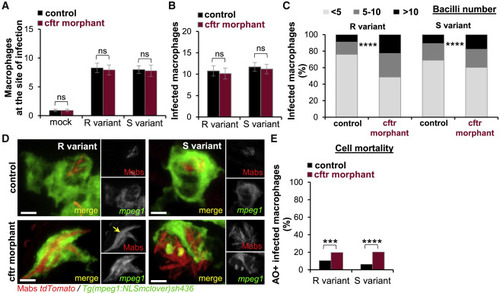
cftr Knockdown Diminishes Intracellular Killing of M. abscessusand Promotes Macrophage Death (A) Control and cftr morphants Tg(mpeg1:NLSmclover)sh436 were infected with Mabs R or S expressing tdTomato into the hindbrain ventricle (HBV). Confocal microscopy was used to monitor the cell recruitment at 2 hpi. Mean ± SEM number of macrophages recruited to the infected HBV (n = 20, two experiments). (B) mpeg1:NLSmclover control and cftr morphants were i.v. infected with Mabs R or S expressing tdTomato. Mean ± SEM number of infected macrophages in the caudal hematopoietic tissue (CHT) at 4 hpi (n = 20, two experiments). (C and D) mpeg1:NLSmclover control and cftr morphants were i.v. infected with Mabs R or S expressing tdTomato imaged at 1 dpi using confocal microscopy to quantify the intracellular bacterial loads. (C) Average proportions of infected macrophages containing fewer than five, five to ten, or more than ten bacteria in the CHT (n = 16, two experiments). (D) Confocal images showing infected macrophages. Although WT-macrophages efficiently contain intracellular bacilli, CF macrophages fail to control Mabs growth. Arrow indicates intracellular Mabs R cording. Scale bars, 2 μm. (E) Control and cftr morphants Tg(mpeg1:mCherry-F)ump2 were i.v. infected with Mabs R or S expressing E2-Crimson and stained with acridine orange (AO). Dead infected macrophages in the CHT were counted using confocal microscopy at 2 dpi. Data are plotted as mean ± SEM from two experiments (n = 20–22). PHENOTYPE:
|

ZFIN is incorporating published figure images and captions as part of an ongoing project. Figures from some publications have not yet been curated, or are not available for display because of copyright restrictions. PHENOTYPE:
|
|
ZFIN is incorporating published figure images and captions as part of an ongoing project. Figures from some publications have not yet been curated, or are not available for display because of copyright restrictions. PHENOTYPE:
|
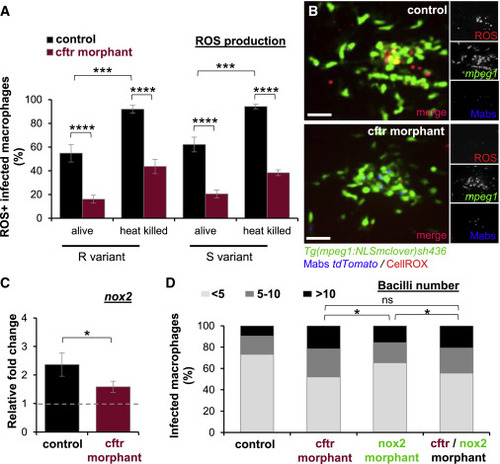
CFTR Modulates NADPH Oxidase-Mediated ROS Production (A and B) mpeg1:NLSmclover controls or cftr morphants were infected with either living or heat-killed Mabs R or S expressing tdTomato into the muscle and stained for ROS production using CellROX deep red and analyzed using confocal microscopy. (A) Proportion of ROS-positive infected macrophages at 2 hpi (n = 16, two experiments). (B) Distribution of representative ROS-producing macrophages within the muscle at 2 hpi. Scale bars, 15 μm. (C) qRT-PCR measurement in whole embryos i.v. infected with Mabs and plotted as fold increase over mock injection for nox2. Mean relative ± SEM gene expression of three independent replicates. (D) mpeg1:NLSmclover controls, cftr, nox2, and double cftr/nox2morphants were i.v. infected with Mabs expressing tdTomato, and intracellular bacterial loads were quantified at 1 dpi using confocal microscopy. Graph represents the average proportions of infected macrophages containing fewer than five, five to ten, or more than ten bacteria in the CHT (n = 15, two experiments). |
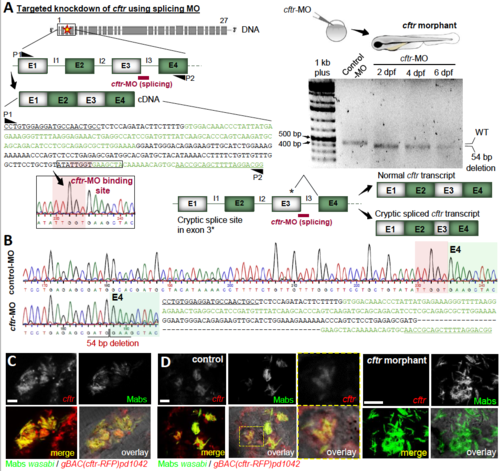
Targeted knockdown of cftr using splicing morpholino in ZF embryos, related to Figure 1 (A-B) A splice targeting morpholino was designed against exon3-intron3 boundary within the cftr gene. (A) Schematic representation and nucleotide sequence corresponding to exon 1 through exon 4 of the ZF cftr gene with the splice morpholino cftr-MO binding site and locations of primers used to amplify the region surrounding exon 3 (P1/P2) (left panel). Altered splicing in cftr MO injected-embryos is verified by RT-PCR (right panel). cftr specific products were amplified from RNA isolated from whole embryos at 2, 4 and 6 dpf. The cftr-MO effectively blocks the splice donor site at the exon3-intron3 boundary, giving rise to an amplicon with a reduce size as compared to the size of the normal cftr transcript, suggesting the existence of a cryptic splice site within exon 3. (B) Comparison of the sequences shows that cftr-MO blocks normal splicing resulting in 54pb deletion in exon 3, thus confirming the efficacy and specificity of this morpholino. (C) Confocal images showing the representative cftr expression in Mabs S- induced granuloma in control-MOinjected gBAC(cftr-RFP)pd104 embryos infected with Mabs expressing Wasabi (5 dpi). Scale bar, 5 μm. (D) Confocal images showing the cftr expression in infected phagocytes in a control or a cftr morphant gBAC(cftr-RFP)pd104 embryos infected with Mabs S expressing Wasabi (5 dpi). Scale bars, 5 μm. |
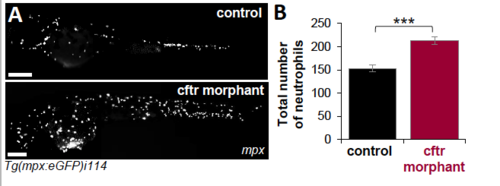
cftr knockdown promotes a basal hyperneutrophilia, related to Figure 4 (A) Representative fluorescence microscopy images of control embryos versus cftr morphants Tg(mpx:eGFP)i114 embryos at 2 dpf. Scale bars, 200 μm. (B) Basal number of neutrophils in whole embryos at 2 dpf. Graphs represent the mean ±SEM of two independent experiments (n=10). Significance was assessed by two-tailed unpaired Student’s t test comparing both infected embryos per category PHENOTYPE:
|
|
ZFIN is incorporating published figure images and captions as part of an ongoing project. Figures from some publications have not yet been curated, or are not available for display because of copyright restrictions. PHENOTYPE:
|
|
ZFIN is incorporating published figure images and captions as part of an ongoing project. Figures from some publications have not yet been curated, or are not available for display because of copyright restrictions. |