
- Title
-
zGrad is a nanobody-based degron system that inactivates proteins in zebrafish
- Authors
- Yamaguchi, N., Colak-Champollion, T., Knaut, H.
- Source
- Full text @ Elife
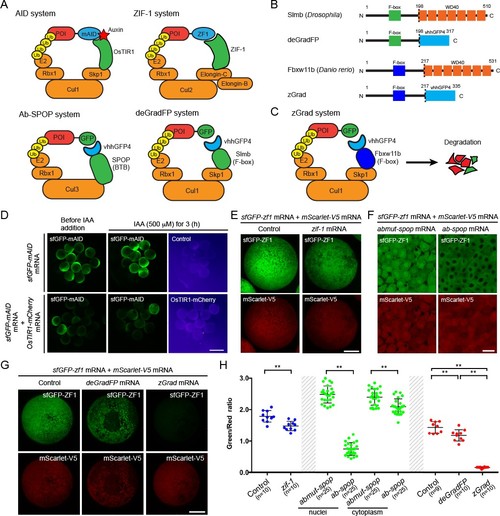
zGrad degrades GFP-tagged proteins in zebrafish.(A) Overview of degron-based protein degradation systems. POI: protein of interest. (B) Comparison of deGradFP and zGrad fusion proteins. (C) Schematic of zGrad-mediated target protein degradation. (D) Representative images of embryos injected with sfGFP-mAID mRNA (210 pg) only (top) or with sfGFP-mAID mRNA (210 pg) and OsTIR1-mCherry mRNA (42 pg) (bottom) before (left, 8 hpf) and after IAA (500 µM) induction for 3 hr (middle and right, 11 hpf). Red channel is shown as a fire map (right). Scale bar: 1 mm. (E) Representative images of embryos injected with sfGFP-ZF1 mRNA and mScarlet-V5 mRNA only (left) or with sfGFP-ZF1 mRNA and mScarlet-V5 mRNA and zif-1 mRNA (right) at 9 hpf. Scale bar: 200 µm. Note that mScarlet-V5 fluorescence served as an internal control. (F) Single-plane confocal images of cells in embryos injected with sfGFP-ZF1 mRNA, mScarlet-V5 mRNA and abmut-spop mRNA (left) or ab-spop mRNA (right) at 9 hpf. Scale bar: 20 µm. (G) Representative images of embryos injected with sfGFP-ZF1 mRNA and mScarlet-V5 mRNA (left) or with sfGFP-ZF1 mRNA and mScarlet-V5 mRNA and deGradFPmRNA (middle) or zGrad mRNA (right) at 9 hpf. Scale bar: 200 µm. (H) Quantification of control and Zif-1-mediated sfGFP-ZF1 degradation shown in E (blue), Abmut-SPOP control and Ab-SPOP-mediated sfGFP-ZF1 degradation shown in F (green), and deGradFP-mediated and zGrad-mediated sfGFP-ZF1 degradation shown in G (red). Mean, SD and n are indicated. **p<0.01. . |
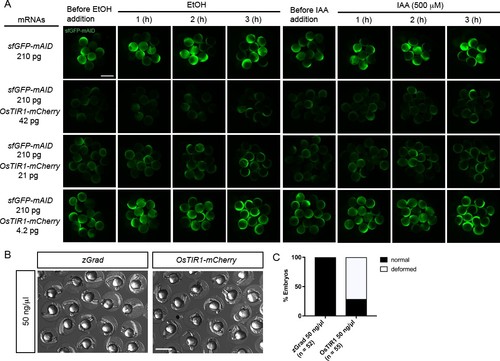
Characterization of the AID system in zebrafish.(A) Images of embryos injected with sfGFP-mAID mRNA and different amounts of OsTIR1-mCherrymRNA and incubated with 0.2%EtOH (left) or the auxin IAA 500 µM (right) over a 3 hr time course. Scale bar: 1 mm. (B) Images of embryos injected with zGrad mRNA and OsTIR1-mCherry mRNA at 24 hpf. Scale bar: 1 mm. (C) Percentage of deformed embryos among embryos injected with zGrad mRNA and OsTIR1-mCherry mRNA at 24 hpf. |
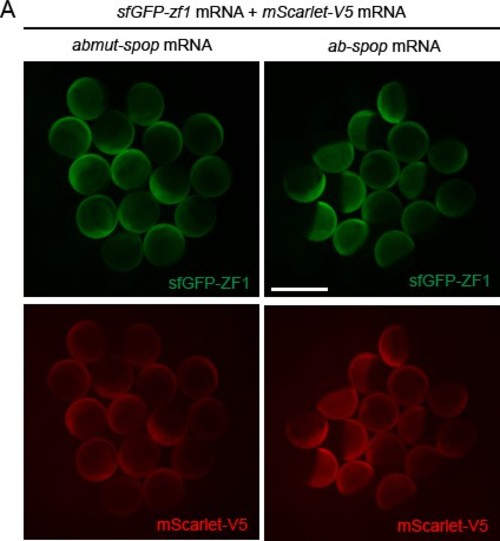
Characterization of the Ab-SPOP system in zebrafish.(A) Images of embryos injected with sfGFP-ZF1 mRNA, mScarlet-V5 mRNA and abmut-spop mRNA (left) or ab-spop mRNA (right) at 8 hpf. Scale bar: 1 mm. |
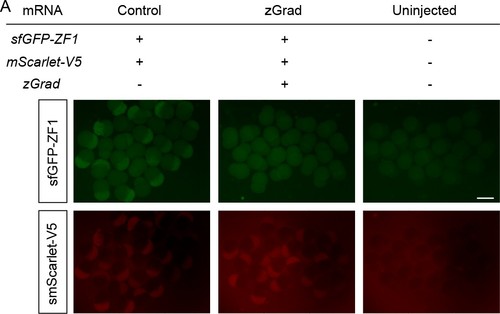
Onset of zGrad-mediated sfGFP-ZF1 degradation in early embryos.(A) Images of embryos injected with sfGFP-ZF1 mRNA and mScarlet-V5 mRNA (left) or sfGFP-ZF1 mRNA and mScarlet-V5 mRNA and zGrad mRNA (middle) and uninjected control embryos (right) at 2.5 hpf. Scale bar: 1 mm. |
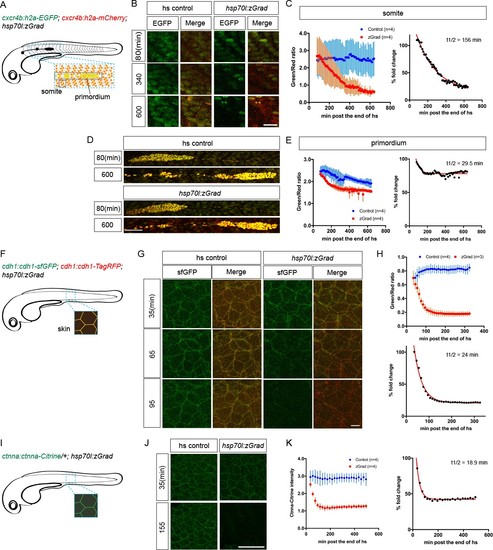
zGrad degrades nuclear, transmembrane and cytoplasmic proteins.(A) Schematic of strategy to assess zGrad-mediated H2A-EGFP degradation in the somites and the primordium. (B) Maximum-projected confocal images of nuclei in the somites in heat-shocked cxcr4b:H2A-EGFP; cxcr4b:H2A-mCherry embryos transgenic for hsp70l:zGrad (right) or not (left) at indicated time in min after the end of heat shock (29–30 hpf). Scale bar: 20 µm. (C) Left, quantification of H2A-EGFP-to-H2A-mCherry ratios in the somites of control (blue) and zGrad-expressing embryos (red) after the end of heat shock in min. Mean and SD are indicated. Right, H2A-EGFP-to-H2A-mCherry ratio of zGrad-expressing embryos normalized to control embryos (black dots) and fitted to a one-exponential decay model (red). (D) Maximum-projected confocal images of primordium nuclei in heat-shocked cxcr4b:H2A-EGFP; cxcr4b:H2A-mCherry embryos transgenic for hsp70l:zGrad (bottom) or not (top) at indicated time in min after the end of heat shock (29–30 hpf). Scale bar: 50 µm. (E) Left, quantification of H2A-EGFP-to-H2A-mCherry ratios in the primordia of control (blue) and zGrad-expressing embryos (red) after the end of heat shock in min. Mean and SD are indicated. Right, H2A-EGFP-to-H2A-mCherry ratio of zGrad-expressing embryos normalized to control embryos (black dots) and fit to a one-exponential decay model (red). (F) Schematic of strategy to assess zGrad-mediated Cdh1-sfGFP degradation in the skin (enveloping and epidermal basal layer). (G) Maximum-projected confocal images of the skin in heat-shocked cdh1:cdh1-sfGFP; cdh1:cdh1-TagRFP embryos transgenic for hsp70l:zGrad (right) or not (left) at indicated time in min after the end of heat shock (31 hpf). Scale bar: 10 µm. (H) Top, quantification of Cdh1-sfGFP-to-Cdh1-TagRFP ratios in the primordia of control (blue) and zGrad-expressing embryos (red) after the end of heat shock in min. Mean and SD are indicated. Bottom, Cdh1-sfGFP-to-Cdh1-TagRFP ratio of zGrad-expressing embryos normalized to control embryos (black dots) and fit to a one-exponential decay model (red). (I) Schematic of strategy to assess zGrad-mediated Ctnna-Citrine degradation in the skin. (J) Maximum-projected confocal images of skin cells in heat-shocked ctnna:ctnna-Citrine/+ embryos transgenic for hsp70l:zGrad (right) or non-hsp70l:zGrad transgenic controls (left) at indicated time in min past the end of heat shock (31 hpf). Scale bar: 50 µm. (K) Left, quantification of Ctnna-Citrine levels in the skin of control (blue) and zGrad-expressing embryos (red) after the end of heat shock in min. Mean and SD are indicated. Right, Ctnna-Citrine levels in zGrad-expressing embryos normalized to Ctnna-Citrine levels in control embryos (black dots) and fit to a one-exponential decay model (red). |
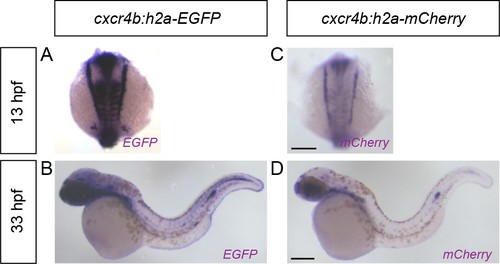
cxcr4b promoter activity during somitogenesis and primordium migration.(A, B) Images of cxcr4b:h2a-EGFP embryos fixed at 13 hpf (A) and 33 hpf (B) and stained by in situ hybridization against EGFP mRNA. (C, D) Images of cxcr4b:h2a-mCherry embryos fixed at 13 hpf (C) and 33 hpf (D) and stained by in situ hybridization against mCherry mRNA. Scale Bars: 200 µm |
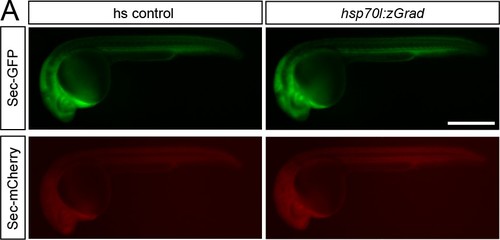
zGrad does not degrade secreted proteins.(A) Images of hsp70l:sec-GFP; hsp70:sec-mCherry control embryos (left) and hsp70l:sec-GFP; hsp70:sec-mCherry; hsp70l:zGrad embryos (right) 5 hr post heat-shock at 30 hpf. Scale bar: 50 µm. |
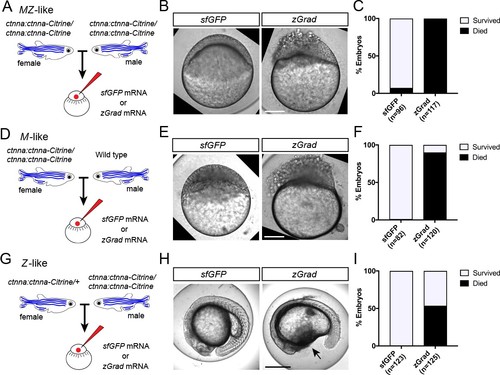
zGrad-mediated depletion of alpha-Catenin results in cell adhesion defects.(A) Breeding strategy to assess zGrad-mediated degradation of maternally and zygotically provided Ctnna-Citrine on embryonic development. (B) Images of MZ ctnna:ctnna-Citrine embryos injected with sfGFP control mRNA (left) or zGrad mRNA (right). Scale bar: 100 µm. (C) Quantification of MZ ctnna:ctnna-Citrine embryos injected with sfGFP control mRNA or zGrad mRNA that disintegrated and died. (D) Breeding strategy to assess zGrad-mediated degradation of maternally provided Ctnna-Citrine on embryonic development. (E) Images of M ctnna:ctnna-Citrine embryos injected with sfGFP control mRNA (left) or zGrad mRNA (right). Scale bar: 100 µm. (F) Quantification of M ctnna:ctnna-Citrineembryos injected with sfGFP control mRNA or zGrad mRNA that disintegrated and died. (G) Breeding strategy to assess zGrad-mediated degradation of zygotically provided Ctnna-Citrine on embryonic development. (H) Images of Z ctnna:ctnna-Citrine embryos injected with sfGFP control mRNA (left) or zGrad mRNA (right). Scale bar: 100 µm. (I) Quantification of Z ctnna:ctnna-Citrine embryos injected with sfGFP control mRNA and zGrad mRNA that displayed tissue rupture (arrow) and died. |
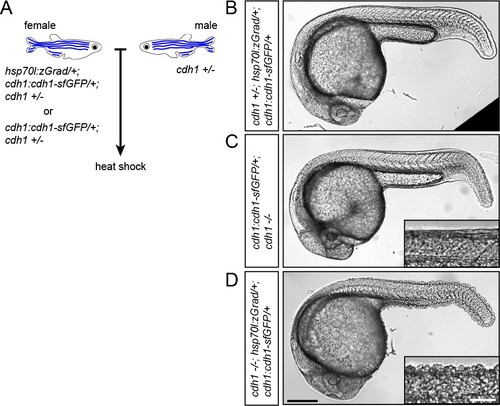
zGrad-mediated depletion of Cadherin-1 at 25 hpf results in skin defects and lethality.(A) Breeding strategy to assess heat shock-induced zGrad-mediated degradation of Cdh1-sfGFP on embryonic development. (B, C, D) Images of cdh1+/-; hsp70l:zgrad/+; cdh1:cdh1-sfGFP/+ control embryo (B), cdh1-/-; cdh1:cdh1-sfGFP/+ control embryo (C) and cdh1-/-; hsp70l:zGrad/+; cdh1:cdh1-sfGFPembryo with skin defects (D) at 29 hpf. Embryos were heat shocked at 25 hpf for 1 hr. Scale bar: 200 µm. Insets in (C, D) are magnified images of the skin in the same embryos. Scale bar: 50 µm. |
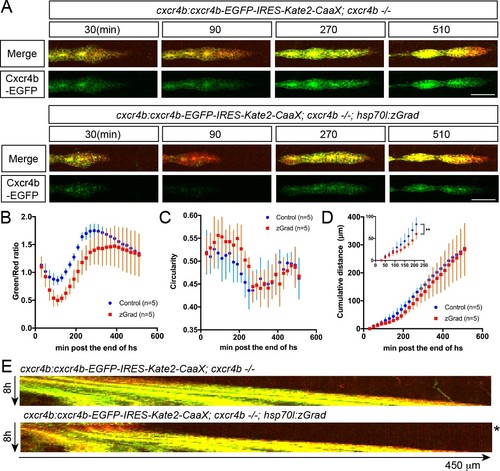
A pulse of zGrad degrades Cxcr4b-GFP and stalls primordium migration transiently.(A) Maximum-projected confocal images of the primordia in heat-shocked cxcr4b:cxcr4b-EGFP-IRES-Kate2-CaaX-p7; cxcr4b-/- embryos transgenic for hsp70l:zGrad (lower panels) or not (upper panels) at indicated time in min after the end of heat shock (31 hpf). Scale bar: 50 µm. (B) Quantification of Cxcr4b-EGFP-to-Kate2-CaaX ratios in the primordia of control (blue) and zGrad-expressing embryos (red) after the end of heat shock in min. Mean and SD are indicated. (C) Quantification of circularity of the primordia of control (blue) and zGrad-expressing embryos (red) after the end of heat shock in min. Mean and SD are indicated. (D) Quantification of the cumulative primordium migration distance in control (blue) and zGrad-expressing embryos (red) after the end of heat shock in min. Mean and SD are indicated. Inset shows magnification of the 30 min to 240 min time interval. **=p < 0.01. (E) Kymograph of the primordia in heat-shocked cxcr4b:cxcr4b-EGFP-IRES-Kate2-CaaX-p7; cxcr4b-/- embryos transgenic for hsp70l:zGrad (bottom) or not (top). Cxcr4b-EGFP is shown in green and Kate2-CaaX in red. Asterisk indicates the time interval in which Cxcr4b-EGFP is transiently degraded and the primordium transiently ceases to migrate |
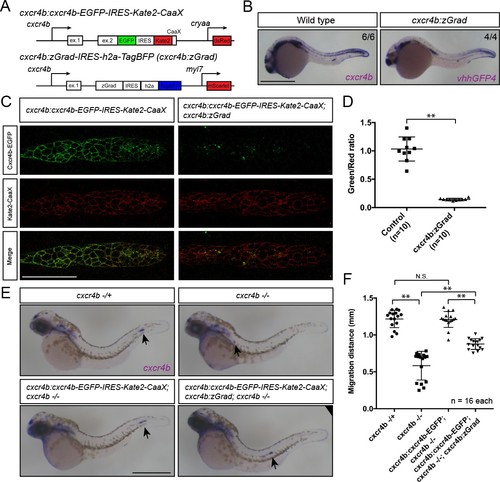
Tissue-specific expression of zGrad in the primordium degrades Cxcr4b-EGFP and slows down primordium migration.(A) Schematic of strategy to assess zGrad-mediated Cxcr4b-EGFP degradation in the primordium on primordium migration. (B) In situ hybridization against cxcr4b mRNA in a wildtype embryo and against zGrad mRNA in a cxcr4b:zGrad embryo at 24hpf. Scale bar: 0.5 mm. (C) Single-plane confocal images of the primordium in cxcr4b:cxcr4b-EGFP-IRES-Kate2-CaaX-p1 control (left) and cxcr4b:cxcr4b-EGFP-IRES-Kate2-CaaX-p1; cxcr4b:zGrad embryos (right) at 36 hpf. Note that the embryos are cxcr4b +/- or cxcr4b -/-. Scale bar: 50 µm. (D) Quantification of Cxcr4b-EGFP to Kate2-CaaX fluorescence intensity ratio in the primordia of control embryos (blue) and embryos expressing zGrad in the primordium at 36 hpf. Mean and SD are indicated. **=p < 0.01. (E) In situ hybridization against cxcr4b mRNA in cxcr4b-/+ (top left), cxcr4b-/- (top right), cxcr4b:cxcr4b-EGFP-IRES-Kate2-CaaX-p1; cxcr4b-/- (bottom left) and cxcr4b:cxcr4b-EGFP-IRES-Kate2-CaaX-p1; cxcr4b-/-; cxcr4b:zGrad embryos (bottom right) at 38 hpf. Arrows indicate the location of the primordium. Scale bar: 0.5 mm. (F) Quantification of primordia migration distance of the indicated genotypes at 38 hpf. Mean, SD and n are indicated. **=p < 0.01, N.S. = p > 0.05 |

Tissue-specific Cxcr4b-EGFP degradation by zGrad.(A) In situ hybridization against cxcr4b mRNA in a 38 hpf cxcr4b:zGrad; cxcr4b -/+ embryo. Arrow indicates the location of the primordium. Scale bar: 0.5 mm. (B) Images of live embryos of indicated genotypes stained for neuromasts with DASPEI at 4 dpf. Note that the cxcr4b:cxcr4b-EGFP-IRES-Kate2-CaaX-p1 transgene carries cryaa:dsRed, which expresses dsRED in the lens, and the cxcr4b:zGradtransgene carries myl7:mScarlet, which expresses mScarlet in the myocardium, as transgenic markers. Arrows indicate the position of the last neuromast. Scale bar: 1 mm. (C) Quantification of the position of the last neuromast normalized to body length of embryos shown in B. **=p < 0.01, N.S. = p > 0.05 |