
- Title
-
Subunits of the mechano-electrical transduction channel, Tmc1/2b, require Tmie to localize in zebrafish sensory hair cells
- Authors
- Pacentine, I.V., Nicolson, T.
- Source
- Full text @ PLoS Genet.

Zebrafish tmieru1000 mutants: Phenotype and functional rescue by Tmie-GFP. All confocal images are of live, anesthetized larvae. (A) Hair cells in the lateral-line neuromasts (7 dpf) and inner ear cristae (5 dpf) from wild type and tmieru1000 larvae. A transgene (Actin-GFP) was used to visualize stereocilia bundles. (B) Sample traces from an auditory evoked behavior response (AEBR) assay, performed on 6 dpf larvae over the course of 3 minutes. Pure tone stimuli are indicated by asterisks. Peaks represent pixel changes due to larval movements (magenta indicates positive response). (C) Quantification of AEBR displayed as box-and-whiskers plot; significance determined by two-tailed unpaired t-test with Welch’s correction. (D) Top-down view of neuromasts from 4 dpf larvae after brief exposure to a vital dye, FM 1–43. FM 1–43 and FM4-64 permeate open transduction channels. (E) Lateral view of a neuromast from a 4 dpf tmieru1000larva expressing transgenic Tmie-GFP, after exposure to FM 4–64. (F) Quantification of FM 4–64 fluorescence/cell in 5 dpf larvae; significance determined by one-way ANOVA. (G) A cartoon depiction of a group of lateral-line hair cells viewed laterally, with close-up views of a single cell at the bundle region. The dashed green line indicates the single plane containing the stereocilia bundles. The magenta bracket indicates the area used to make the maximum projections that were analyzed for FM fluorescence in (F). (H) Sample traces of extracellular (microphonic) recordings, evoked from the inner ear of 3 dpf larvae. A piezo actuator was used to stimulate larvae with a 200 Hz sine-wave mechanical stimulus using an 8 V driver voltage. All statistics are mean ± SD, ****p < 0.0001. Scale bars are 10μm. PHENOTYPE:
|

Tmie-GFP is present in the hair bundles of MET mutants. Confocal images of the bundle region in hair cells of the inner ear lateral cristae in 6 dpf larvae. Larvae expressing transgenic Tmie-GFP in the genetic backgrounds of wild type (A), and homozygous mutants for the tip link protein Pcdh15a (B, pcdh15apsi7), the accessory protein Lhfpl5a (C, lhfpl5atm290d), and the Golgi-localized protein Tomt (D, tomttk256c). Tomt-deficient fish lack Tmc expression in hair cell bundles [11], presumably mimicking the condition of a triple Tmc knockout. Arrowheads indicate splayed hair bundles. n = 8 each genotype. Scale bar is 5μm. EXPRESSION / LABELING:
|
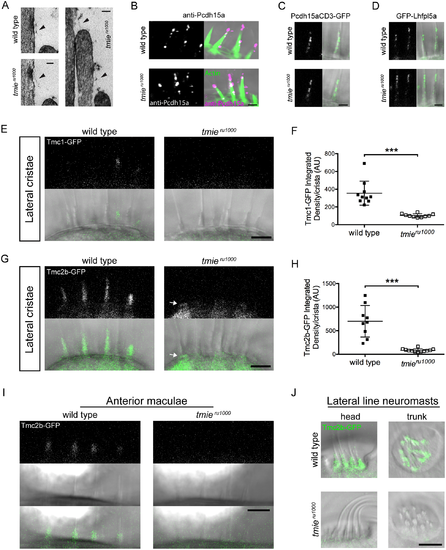
Specific loss of Tmc1 and Tmc2b in tmieru1000 larvae. Images in A were collected using a transmission electron microscope (TEM). Images in B-J were collected using confocal microscopy. (A) TEM sections stained with 4% uranyl acetate and lead citrate. (B) Antibody labeling of Pcdh15a (magenta). Phalloidin was used to label actin (green). (C, D) Hair cells from the lateral cristae in 6 dpf larvae expressing either transgenic Pcdh15aCD3-GFP (C) or GFP-Lhfpl5a (D) (n = 6 each genotype). (E) Images of the lateral cristae in 4 dpf larvae expressing Tmc1-GFP. (F) Plot of the integrated density of Tmc1-GFP fluorescence in the ROI, expressed in arbitrary units; each data point represents one crista. Statistical significance determined by two-tailed unpaired t-test with Welch’s correction, p = 0.0002. (G) Images of the lateral cristae in 4 dpf larvae expressing Tmc2b-GFP. The arrow points to the cuticular plate/apical soma region, just below the ROI. (H) Plot of the integrated density of Tmc2b-GFP fluorescence in the ROI, expressed in arbitrary units. Statistical significance determined by two-tailed unpaired t-test with Welch’s correction, p = 0.0005. (I) Representatives images of anterior maculae in 2 dpf larvae expressing Tmc2b-GFP. We examined n = 14 wild type and n = 13 tmieru1000 maculae. (J) Representative images of lateral line neuromasts in 4 dpf larvae expressing Tmc2b-GFP. We examined n = 18 wild type and n = 20 tmieru1000 neuromasts. All statistics are mean ± SD. Scale bar in A is 50 nm, in B-D are 2 μm, in E-J are 5μm. |
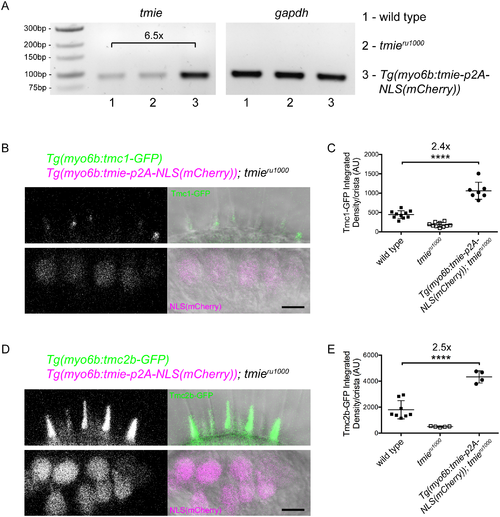
Overexpression of Tmie causes increased bundle expression of Tmc1-GFP and Tmc2b-GFP. (A) Semi-quantitative PCR of tmie cDNA using primers within exon 4 to detect transcripts from both transgene and the endogenous gene. We generated cDNA from RNA extracted from 5 dpf whole larvae. Larvae carrying Tg(myo6b:tmie-p2A-NLS(mCherry)) had 6.5-fold more tmie transcript than wild type non-transgenic siblings. Products are from 40 cycles. Less PCR reaction (2.5x less) was loaded for gapdh to avoid saturation. (B) Confocal images of the lateral cristae in 4 dpf tmieru1000 larvae co-expressing two transgenes, tmc1-GFP (upper panel) and tmie-p2A-NLS(mCherry) (lower panel). The p2A linker is a self-cleaving peptide that results in equimolar translation of Tmie and nuclear mCherry. (C) Plot of the integrated density of Tmc1-GFP fluorescence/crista in the ROI, expressed in arbitrary units; significance determined by one-way ANOVA. (D-E) Same as B-C except using tmc2b-GFP instead of tmc1-GFP. All statistics are mean ± SD. Scale bars are 5μm. |

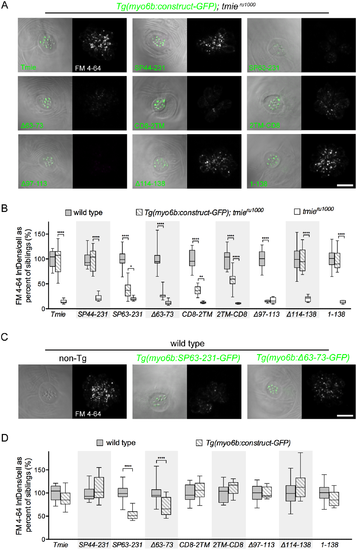
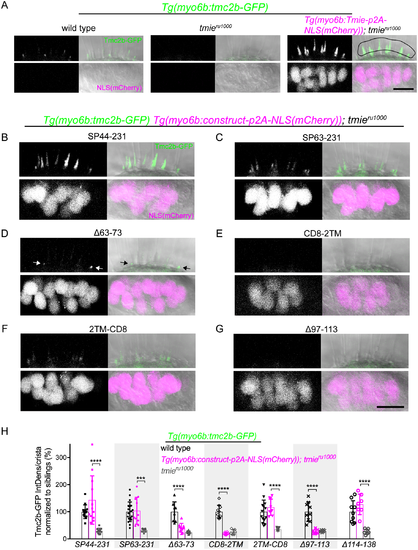
Schema for a systematic domain analysis of Tmie and subcellular localization of Tmie constructs. (A) A linear diagram of 13 unique constructs of Tmie used in our experiments. Full-length zebrafish Tmie contains two hydrophobic regions predicted to form transmembrane helices (1TM and 2TM). SP44-231 and SP63-231 replace part of the N-terminus with a signal peptide (SP) from the Glutamate receptor 2a (in blue). In the CD8, CD8-2TM, and 2TM-CD8 constructs, all or part of the 2TM is replaced by the helix from the CD8 glycoprotein (in yellow). Tmie-short is a fish-specific isoform of Tmie that contains an alternate final exon (in orange). Dotted lines represent internal deletions. (B) Representative confocal images of each construct being expressed as a GFP-tagged transgene in hair cells of 4–6 dpf tmieru1000 larvae. Expression is mosaic due to random genomic insertion into subsets of progenitor cells after single-cell injection. All images are of cells in the inner ear cristae. Scale bar is 5μm. (C) The localization of each GFP fusion protein was determined by measuring the fluorescence/area in the bundle (b) and soma (s), and then calculating b / (b+s). (D) Enrichment in the hair bundle is displayed as a ratio for each construct, with 1 being completely bundle-enriched and 0 being completely soma-enriched. |
The second transmembrane and adjacent residues of Tmie are required for rescue of FM labeling. All images are a top-down view of a representative neuromast from 6 dpf larvae collected using confocal microscopy. The left image is a single plane through the stereocilia (green dashed line in Fig 1G) with DIC + GFP fluorescence. The right image is a maximum projection of the 7 sections in the soma region (magenta bracket in Fig 1G) showing FM 4–64 fluorescence. (A) Representative images of neuromasts in tmieru1000 larvae, each stably expressing an individual tmie construct. FM fluorescence was normalized to wild type non-transgenic larvae generated with the Tmie-GFP line. (B) Box-and-whiskers plot of the integrated density of FM fluorescence/cell for each tmieconstruct. We normalized values to the average of wild type siblings for each construct. (C) Representative images of neuromasts in wild type larvae with or without transgene. FM fluorescence was normalized to wild type non-transgenic larvae of the Tmie-GFP line. (D) Box-and-whiskers plot of the integrated density of FM fluorescence/cell in wild type neuromasts with and without tmie transgene. We normalized values to the average of wild type siblings for each construct. Significance determined within each clutch by one-way ANOVA, n ≥ 9, **p < 0.01, ***p < 0.001, ****p < 0.0001. Scale bars are 10μm. |
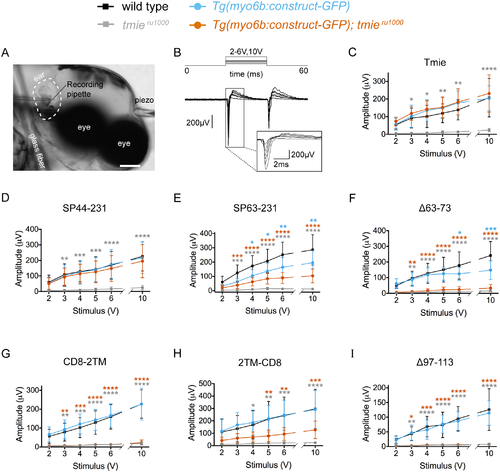
The second transmembrane and adjacent regions of Tmie are required for inner ear microphonics. (A) A DIC image of a 3 dpf larva, anesthetized and pinned (glass fiber) for inner ear recordings. Shown are a probe attached to a piezo actuator (piezo) pressed against the head and a recording pipette pierced into the inner ear. Scale bar is 100μm. (B) Example traces from a wild type larva. A step stimulus was applied with a 20 ms duration; 200 traces were averaged for each of the six piezo driver voltages: 2V, 3V, 4V, 5V, 6V, and 10V. Gray box: magnification of the onset of response in individual traces. (C-I) Plots of the mean amplitude of the response peak ± SD as a function of the stimulus intensity of the driver voltage. We used the stimulation protocol explained in B to obtain responses from larvae expressing one of our transgenic tmie constructs, as labeled. Statistical significance was determined by two-way ANOVA comparing all groups to wild type non-transgenic siblings, n ≥ 5, *p < 0.05, **p < 0.01, ***p < 0.001, ****p < 0.0001. PHENOTYPE:
|
Effect of transgenic Tmie constructs on Tmc2b-GFP bundle localization. Confocal images are maximum projections of representative inner-ear lateral cristae collected from 4 dpf larvae. Upper panels show the bundle region, with all larvae stably expressing transgenic Tmc2b-GFP (green). Lower panels show the soma region, with some larvae expressing transgenic Tmie constructs tagged with p2A-NLS(mCherry). Nuclear mCherry (magenta) is a marker for equimolar translation of the indicated Tmie construct. Two tmie construct lines contained stable transgene insertions (SP44-231, CD8-2TM), whereas F1 larvae were used for the Δ63–73, Δ97–113, and Δ114–138 constructs; for the SP63-231 construct, we used a mix of larvae with stable insertions or F1 offspring. (A) Sibling wild type, tmieru1000, and tmieru1000 expressing transgenic Tmie. For the quantification in H, Tmc2b-GFP fluorescence was measured within the ROI (right panel, black line). (B-G) Images of lateral cristae from tmieru1000 larvae expressing individual tmie constructs tagged with p2A-NLS(mCherry), as labeled. The arrows in D point to Tmc2b-GFP in immature hair bundles. (H) Plot of the integrated density of Tmc2b-GFP fluorescence in the ROI, comparing tmieru1000 larvae expressing a tmie construct (magenta) to wild type (black) and tmieru1000 (gray) siblings not expressing tmie construct. We normalized values to the average of wild type siblings for each construct. Significance for SP44-231, SP63-231, and 2TM-CD8 was determined by the Kruskal-Wallis test, for all other tmie constructs by one-way ANOVA, n ≥ 6, ***p < 0.001, ****p < 0.0001. Scale bars are 10μm. |
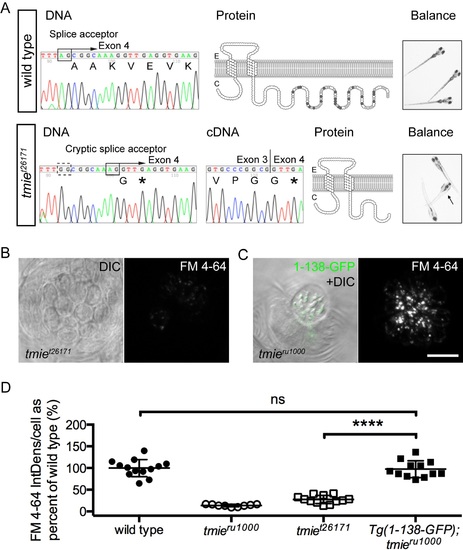
Differential effects on function with a genomic mutation and a transgene mimic.(A) Data for a novel mutant allele of tmie, t26171. DNA: Chromatographs of the DNA sequence of tmie in wild type (above) and tmiet26171 (below) showing the genomic region where the mutation occurs. An arginine is mutated to guanine in the splice acceptor (black box, above) of the final exon of tmie, exon 4. The dashed black box below indicates the mutated original splice acceptor site. Use of a cryptic splice acceptor (black box, below) 8 nucleotides downstream causes a frameshift and an early stop codon (*). cDNA: Chromatograph of the DNA sequence from RT-PCR of tmiet26171 larvae bridging exons 3 and 4. Protein: The predicted protein products, shown here as a two-pass transmembrane protein. The wild type protein has many charged residues (positive in light gray, negative in dark gray) that are lost in tmiet26171. Balance: Photos of wild type and tmiet26171 larvae, taken with a hand-held Canon camera. Arrow points to a larva that is upside-down, displaying a classic vestibular phenotype. (B) Top-down view of a representative neuromast after exposure to FM 4–64, imaged using confocal microscopy. The first panel is a single plane through the soma region while the second panel is a maximum projection of 7 panels through the soma region, beginning at the cuticular plate (as denoted by magenta bracket in Fig 1G). (C) Same as (B) except that the first panel shows the bundle region so that 1-138-GFP can be visualized in bundles (as depicted by dashed green line, Fig 1G). The transgene is driven by the myo6b promoter. (D) Plot of the integrated density of FM fluorescence per cell. We normalized values to the average of wild type siblings. Displayed wild type and tmieru1000 data are from siblings of Tg(1-138-GFP); tmieru1000 and are the same values reported in Fig 6. Data for tmiet26171 is from a separate experiment. Statistical significance determined by one-way ANOVA, ****p<0.0001. Scale bar is 10μm. |
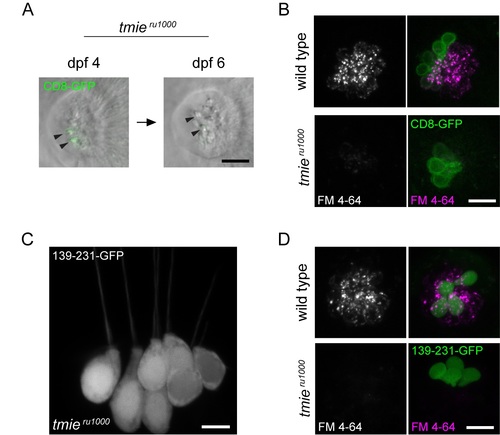
Expression pattern and functional rescue by tmie constructs CD8 and 139–231.All images were captured using confocal microscopy. (A) Stereocilia of a neuromast viewed from above. The same neuromast was imaged at 4 dpf and 6 dpf. In hair cells expressing CD8-GFP, signal was initially detected in immature bundles, but this expression was only detectable in soma by dpf 6 as the cells matured (n = 10 cells). (B) Maximum projection of neuromasts viewed from above; left panel shows only FM 4–64 while right panel adds CD8-GFP. No rescue of FM 4–64 labeling was observed in tmieru1000 hair cells expressing CD8-GFP (n = 40 cells). (C) Maximum projection of the posterior crista in a tmieru1000 larva with some hair cells expressing 139-231-GFP, which fills the cell (n = 43 cells). (D) Same as B except the transgene being expressed is 139-231-GFP. No rescue of FM 4–64 labeling was observed in tmieru1000hair cells expressing 139-231-GFP (n = 33 cells). Scale bars in A and C are 5μm, in B and D are 10μm. |