- Title
-
Nr2f-dependent allocation of ventricular cardiomyocyte and pharyngeal muscle progenitors
- Authors
- Dohn, T.E., Ravisankar, P., Tirera, F.T., Martin, K.E., Gafranek, J.T., Duong, T.B., VanDyke, T.L., Touvron, M., Barske, L.A., Crump, J.G., Waxman, J.S.
- Source
- Full text @ PLoS Genet.
|
RA signaling directly regulates nr2f1a expression. (A-C) In situ hybridization (ISH) for nr2f1a in control (ctrl), DEAB-treated, and RA-treated embryos at the 8s stage. (D-G) ISH for nr2f1a in the LPM of ctrl, RA, CHX, and RA+CHX treated embryos. (H) RT-qPCR of nr2f1a expression after RA and CHX treatments at the 3s stage. Asterisks in all graphs indicate statistically significant difference from controls with p<0.05. EXPRESSION / LABELING:
PHENOTYPE:
|
|
Loss of nr2f2 alleles in nr2f1a mutants produces stronger overt cardiovascular defects. (A) Two-color ISH for nr2f1a (blue) and nkx2.5:ZsYellow (red) at the 8s stage. Embryo is flat-mounted with dorsal view and anterior left. (B-E) Lateral views of the nr2f1awt; nr2f2wt, nr2f1amut; nr2f2wt, nr2f1amut; nr2f2het, and nr2f1amut; nr2f2mut embryos. n = 16 overtly WT embryos and n = 32 embryos with edema that were genotyped for the experiment shown. While embryos that have two WT alleles are shown, the other combinations of nr2f1a and nr2f2 alleles, other than nr2f1ahet; nr2f2mut embryos, were indistinguishable from WT embryos at 48 hpf. 1 of 5 embryos that genotyped as nr2f1ahet; nr2f2mut embryos was indistinguishable from WT, while 4 of the 5 nr2f1ahet; nr2f2mut embryos displayed a very small amount of blood pooling on the yolk. However, cardiac defects were not found in these embryos. Arrows indicate edema and blood pooling on the yolk. Arrowheads indicated pericardial edema. EXPRESSION / LABELING:
PHENOTYPE:
|

ZFIN is incorporating published figure images and captions as part of an ongoing project. Figures from some publications have not yet been curated, or are not available for display because of copyright restrictions. |
|
Nr2f1a and Nr2f2 redundantly restrict differentiation of ventricular CMs. (A-D) ISH for vmhc in nr2f1awt; nr2f2wt, nr2f1amut; nr2f2wt, nr2f1amut; nr2f2het, and nr2f1amut; nr2f2mut embryos at the 20s stage. (E) Area measurements in arbitrary units (AU) of vmhc expression from nr2f1actrl; nr2f2ctrl (n = 141), nr2f1amut; nr2f2wt (n = 8), nr2f1amut; nr2f2het (n = 22), and nr2f1amut; nr2f2mut (n = 18) embryos at the 20s stage. EXPRESSION / LABELING:
PHENOTYPE:
|
|
Nr2f1a; nr2f2 mutants have deficiencies in their posterior PMs. (A-D) PMs in nr2f1awt; nr2f2wt, nr2f1amut; nr2f2wt, nr2f1amut; nr2f2het, and nr2f1amut; nr2f2mut embryos with the actc1b:GFP transgene at 96 hpf. IHC was performed for GFP. Views are lateral with anterior to the left and dorsal up. Arrows in C and D indicate largely absent protractor pectoralis (pp). Brackets in C and D indicate 1st and 2nd arch PMs. ah–adductor hyoideus, ao–adductor operculi, do–dilator operculi, lap–levator arcus palitini. Muscle nomenclature used is from [55]. (E) Percentage of nr2f1actrl; nr2f2ctrl (n = 18), nr2f1amut; nr2f2wt (n = 10), nr2f1amut; nr2f2het (n = 29), and nr2f1amut;nr2f2mut (n = 15) embryos with loss or malformed pp muscles at 96 hpf. |
|
Tcf21+ progenitors less frequently contribute to the pp muscle in nr2f1a-2mutant embryos. (A) Two-color ISH of nr2f1a (blue) and tcf21:EGFP (red). Embryo is flat-mounted with anterior leftward. Bracket indicates region of overlap. (B) Schematic of tcf21:CreERT2recombinase and ubiquitous Cre-mediated color-switch transgenic lines used. (C, D) PMs (arrowhead) labeled in nr2f1a-2ctrl and nr2f1a-2mut embryos with the tcf21:CreERT2; ubi:CsY transgenes. Labeled PMs–yellow. Muscles (MHC)–blue. Outlines indicate PMs with labeled skeletal muscles. While other cells were labeled within the pharyngeal region, they were not scored as skeletal muscle because they were not located within the muscles or had morphology consistent with skeletal muscle. View is lateral with anterior to the left and dorsal up. (E) Percentage of labeled PMs on each side of the nr2f1a-2ctrl (n = 74) and nr2f1a-2mut (n = 104) embryos. The (n) reflects the total number of sides examined, since labeling was not equivalent on both side of an embryo. aPMs—anterior pharyngeal muscles, pp—protractor pectoralis. 44/74 nr2f1a-2ctrl and 66/104 nr2f1a-2mut had muscle labeled in aPMs. 23/74 nr2f1a-2ctrl and 13/104 nr2f1a-2mut had muscle labeled in the pp. Fisher’s exact test was used to determine if there was a difference between the frequency of anterior and posterior PMs in nr2f1a-2ctrl and nr2f1a-2mut embryos. EXPRESSION / LABELING:
PHENOTYPE:
|

ZFIN is incorporating published figure images and captions as part of an ongoing project. Figures from some publications have not yet been curated, or are not available for display because of copyright restrictions. |
|
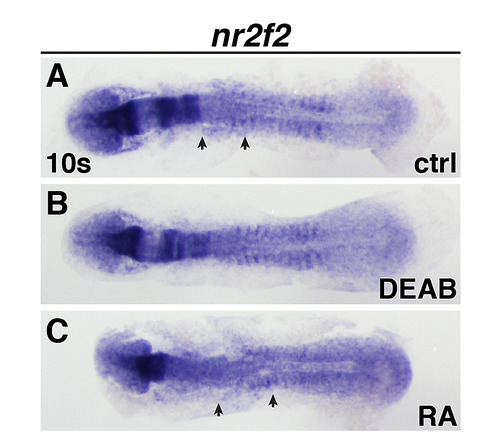
Nr2f2 expression at the 10 somite stage.(A-C) Nr2f2 expression in the ALPM of control, DEAB-treated, and RA-treated embryos. View is dorsal with anterior left. Arrows indicated anterior and posterior limits of expression in control and RA-treated embryos. EXPRESSION / LABELING:
PHENOTYPE:
|
|
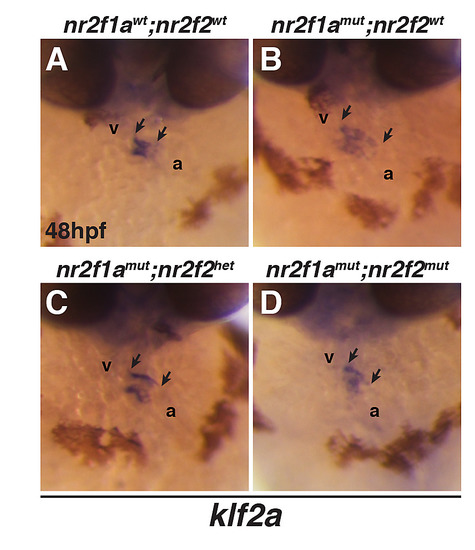
(A-D) ISH for the endocardial atrioventricular canal marker klf2a. Frontal views of hearts in nr2f1awt; nr2f2wt, nr2f1amut; nr2f2wt, nr2f1amut; nr2f2het, and nr2f1amut; nr2f2mut embryos. v–ventricle. a–atrium. Arrows indicate the length of klf2a expression within the hearts. EXPRESSION / LABELING:
|
|
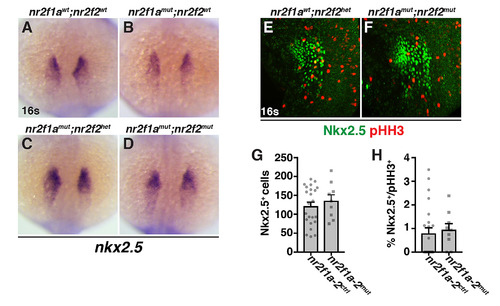
(A-D) ISH for the cardiac progenitor marker nkx2.5 in nr2f1awt; nr2f2wt, nr2f1amut; nr2f2wt, nr2f1amut; nr2f2het, and nr2f1amut; nr2f2mut embryos at the 16s stage. Dorsal view with anterior up. 160 embryos were examined with ≥9 embryos examined for each condition. Although we observed a trend in the expansion of nkx2.5 expression when assaying area of expression similar to vmhc, due to inherent variability in nkx2.5 expression and the low numbers of embryos, it was not statistically significant. (E,F) IHC for Nkx2.5 and pHH3 in nr2f1awt; nr2f2het and nr2f1amut; nr2f2mut embryos at the 16s stage. Confocal images of the ventro-lateral side of the embryo. Dorsal is right and anterior up. A single side of each embryo was used for analysis. (G) Number of Nkx2.5+ cells in control and nr2f1a; nr2f2mutant embryos. (H) Percentage of pHH3+/Nkx2.5+ in control and nr2f1a; nr2f2 mutant embryos. For quantification of Nkx2.5+ and pHH3+/Nkx2.5+ cells, nr2f1a homozygous mutants (nr2f1amut) coupled with nr2f2 heterozygosity (nr2f2het) or nr2f2 mutant homozygosity (nr2f2mut) were analyzed together (referred to as nr2f1a-2mut), because our data suggest loss of a single WT nr2f2 allele in nr2f1a mutants produces a similar increase in ventricular CMs as double mutants. Nr2f1a-2ctrl includes any combination of nr2f1a and nr2f2 WT and heterozygous alleles. nr2f1a-2ctrl (n = 23) and nr2f1a-2mut (n = 9) for G and H. EXPRESSION / LABELING:
PHENOTYPE:
|
|
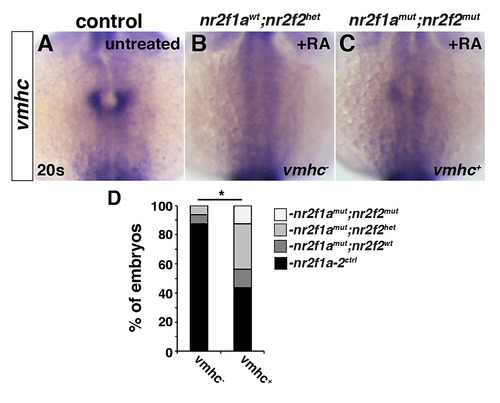
(A-C) ISH for vmhc in control (untreated), RA-treated nr2f1awt; nr2f2het, and RA-treated nr2f1amut; nr2f2mut embryos at the 20s stage. Control embryos were not genotyped. (D) Percentage of embryos with the genotypes found that lacked vmhc expression (n = 16) or had vmhc expression (n = 16). Although a RA-treated nr2f1awt; nr2f2het is shown in B, nr2f1a-2ctrl includes any combination of nr2f1a and nr2f2 WT and heterozygous alleles. Fisher’s exact test was used to compare the frequency of embryos with two nr2f1amutalleles found in each condition. EXPRESSION / LABELING:
PHENOTYPE:
|
|
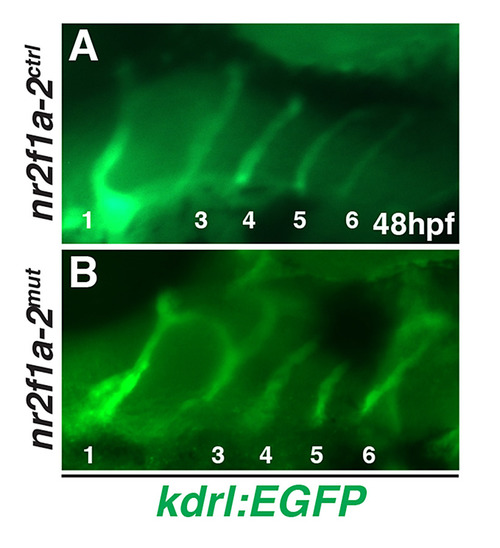
(A,B) PAAs in nr2f1a-2ctrl and nr2f1a-2mut embryos. Numbers indicated arches. Anterior is to the right. EXPRESSION / LABELING:
|
|
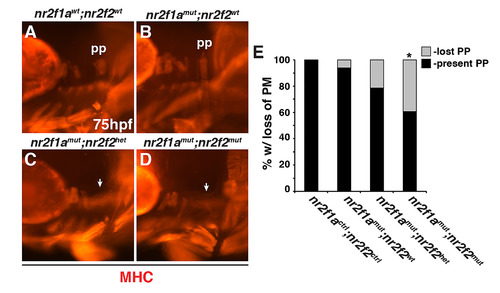
(A-D) PMs in nr2f1awt; nr2f2wt, nr2f1amut; nr2f2wt, nr2f1amut; nr2f2het, and nr2f1amut; nr2f2mut embryos at 75 hpf. Views are lateral with anterior to the left and dorsal up. (E) Percentage of nr2f1actrl; nr2f2ctrl (n = 7), nr2f1amut; nr2f2wt (n = 16), nr2f1amut; nr2f2het (n = 28), and nr2f1amut; nr2f2mut (n = 28) embryos with loss of posterior and malformed PMs at 75 hpf. EXPRESSION / LABELING:
PHENOTYPE:
|
|
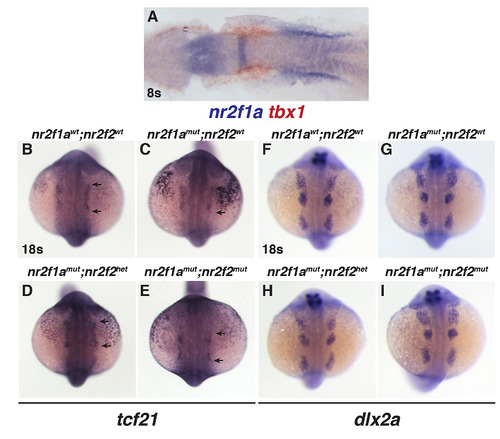
(A) ISH for tbx1 (red) and nr2f1a (blue) in the ALPM of an embryo at the 8s stage. Image is a dorsal view with anterior rightward of a flat-mounted embryo. (B-E) ISH for tcf21 in the ALPM of nr2f1awt; nr2f2wt, nr2f1amut; nr2f2wt, nr2f1amut; nr2f2het, and nr2f1amut; nr2f2mutembryos at the 18s stage. (F-I) ISH for the neural crest marker dlx2a in nr2f1awt; nr2f2wt, nr2f1amut; nr2f2wt, nr2f1amut; nr2f2het, and nr2f1amut; nr2f2mut embryos at the 18s stage. For B-I, views are dorsal with anterior up. EXPRESSION / LABELING:
|

