
- Title
-
The Surface Proteome of Adult Neural Stem Cells in Zebrafish Unveils Long-Range Cell-Cell Connections and Age-Related Changes in Responsiveness to IGF
- Authors
- Obermann, J., Wagner, F., Kociaj, A., Zambusi, A., Ninkovic, J., Hauck, S.M., Chapouton, P.
- Source
- Full text @ Stem Cell Reports
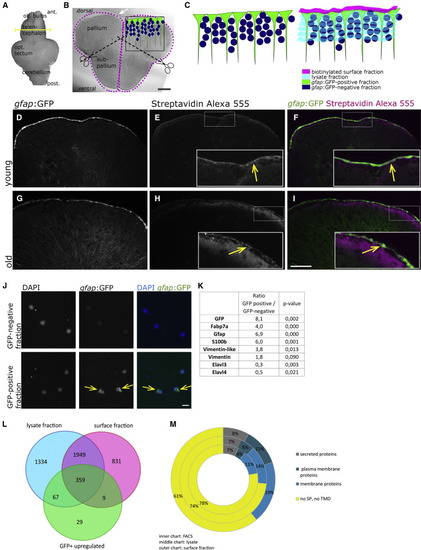
Proteome Identification (A) The biotinylation reaction was performed on freshly isolated brains. The yellow line depicts the location of the cross-section shown in (B). (B) Cross-section through the telencephalon of a zebrafish. Biotinylated surfaces are depicted as magenta dots. The upper surface of the pallium borders the ventricle, located below the tela choroidea (white arrow) and is composed of the cell somata of the radial glia (depicted in green in the inset). The midline between both hemispheres is also filled by a thin part of the ventricle. After the biotinylation reaction, telencephalons were separated into the dorsal part (pallium) and ventral part (subpallium). (C) Drawing of the fractions isolated by FACS and by biotinylation, depicting in green the radial glia, in dark blue the remaining cells of the telencephalon, in magenta the biotinylated fraction containing the cell surfaces of the radial glia, and in light blue the lysate fraction containing the remainder of these cells as well as the rest of the telencephalon. (D–I) Histochemistry on cross-sections with streptavidin coupled to AlexaFluor 555 after biotinylation of the brain, revealing the expected binding of biotin on the cell surfaces in young (D–F) and old (G–I) brains. (J) Cells of the GFP-positive and -negative fraction plated directly after the sorting; nuclei are stained by DAPI. (K) Known proteins isolated on FACS-sorted radial glia. (L) The overlaps between the surface fraction, lysate fraction, and GFP-positive fraction are represented. The majority (79.3%) of proteins identified in the FACS-GFP-positive fraction were also found in the biotinylated fraction. (M) Identified proteins were categorized according to the presence of signal peptides and transmembrane domains, revealing an enrichment of plasma membrane proteins in the biotinylated fraction compared with the lysate and to the FACS-retrieved proteins.
|
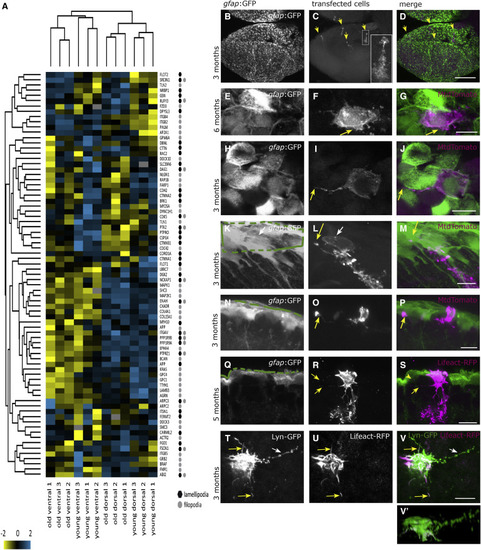
Proteins Associated with Lamellipodia and Filopodia, Detected in Apical and Basolateral Locations of the Radial Glia (A) Hierarchical clustering for proteins associated with lamellipodia and filopodia, revealing that some of them display age-related changes. (B–V′) Lipofections in vivo were performed and imaged after fixation as whole-mount preparations or as sections (Q–S). (B–D) Overview of one telencephalic hemisphere visualized from the top onto the dorsal surface as a maximum-intensity projection. (B) Cell bodies of the radial glia are labeled by the gfap:GFP transgene. (C) A small, variable number of cells per brain were labeled by the in vivo lipofection (maximum 12 cells per brain); their somata and branched radial processes into the parenchyme are visible (inset is a higher magnification), revealing the soma at the top (apical side) and the radial process in the parenchyme with numerous branches. All lipofected cells displayed this radial process, but it is not visible on all pictures. (D) Merged channels. (E–G) Apical surface of one radial glia, viewed from the top, depicting the existence of lamellipodia extending laterally (arrow in F and G). (H–J) Apical surface of one radial glia, depicting the existence of filopodia (arrow in I and J). (K–M) Filopodia are also extending from the basolateral cell surface toward apical locations on neighboring cells (arrow in L and M). (N–P) The longest filopodia span below 4 cell diameters. (Q–S) lipofection with Lifeact-RFP also reveals basolateral extensions (arrows in R and S). (T–V) Apical view on a cell co-lipofected with the membrane-localized Lyn-GFP (T) and the F-actin localized Lifeact-RFP (U) revealing the presence of filopodial extensions with F-actin (yellow arrows) or without (white arrow). (V′) Lateral view of the same cell. Green lines in (K), (N), and (Q) depict the ventricular surface. Scale bars, 100 μm (D) and 10 μm (G, J, M, P, S, and V). |
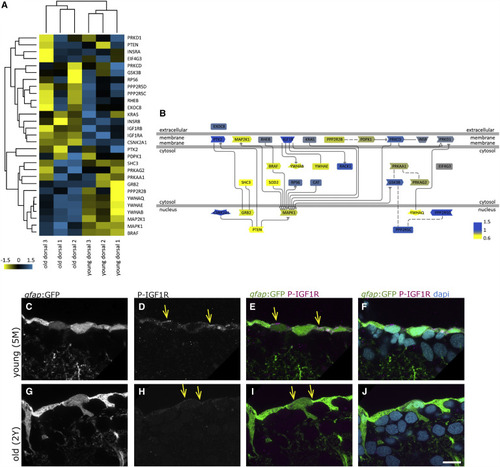
The IGF Signaling Pathway Declines with Age (A) Hierarchical clustering of the IGF, Insulin, and Akt pathway protein members identified in the surface fraction, revealing the differential expressions in young and old dorsal surface fractions (scale: log2 young/old). Insulin receptor B, as well as IGF1 receptors a and b, are downregulated with age, while some other components are upregulated (i.e., MAP2K1 and BRAF). (B) Representation of the signaling pathway with color coding (blue, upregulated young; yellow, upregulated old). (C–J) Phosphorylated IGF1R (P-IGF1R) immunohistochemistry (Tyr1161) on young (5 months, C–F) and old (2 years, G–J) brains as a close-up view on the ventricular surface of the dorsal pallium depicted as single confocal planes. The radial glia somata, located at the border of the ventricle, express P-IGF1R (yellow arrows). We observe the distinct expression levels of P-IGF1R in young and old brains in a total of 4 young and 4 old immunosamples. Scale bar, 10 μm |
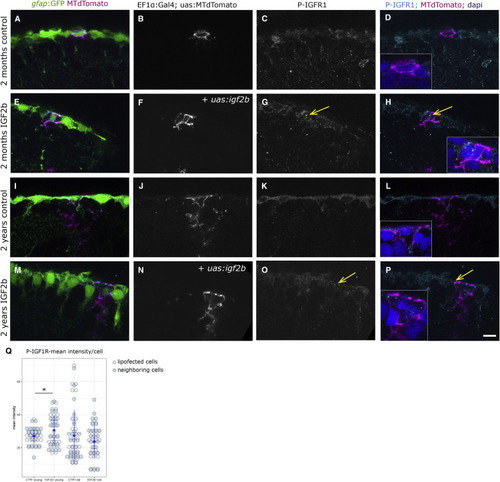
IGF2b Overexpression Activates the IGF1R in Lipofected Cells (A–P) P-IGF1R immunohistochemistry on young (A–H) and old (I–P) brains. The radial glia are labeled by the gfap:GFP transgene. Single cells in magenta have been lipofected in vivo 4 days prior to brain fixation with mtdTomato (control, A–D and I–L) or with mtdTomato and igf2b (IGF2b, E–H and M–P), highlighting primarily the cell soma (the radial process is not always in the plane of the optical section, but it is present below the somata of lipofected cells). We observe the distinct expression levels of P-IGF1R in young control (C and D), young + IGF2b (highest, arrows in G and H), old control (K and L), and old + IGF2b (a few dots, arrows in O and P). Insets in (D), (H), (L), and (P) are close-ups of the lipofected cells; nuclei in blue stained by DAPI. Single confocal planes are displayed. Scale bar, 10 μm. (Q) The mean intensity of the phospho-IGF staining was measured on 7 lipofected cells and their immediate neighbors in each condition. Staining intensities differ significantly between control and igf2b-lipofected brains (t test; p = 0.030) in young but not in old brains. |
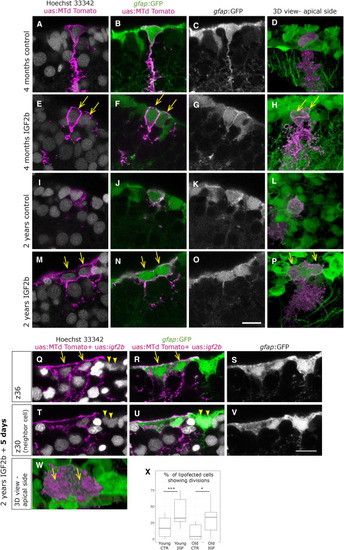
Overexpression of IFG2b Induces Complete Cell Division in Young Cells, but Incomplete Division in Old Cells (A–P) Brains were lipofected in vivo 4 days prior to fixation with mtdTomato (control, A–D and I–L) or with mtdTomato and igf2b (IGF2b, E–H and M–P). Single confocal planes are displayed in the left panels and 3D reconstructions in the rightmost panels (D, H, L, and P). Cell nuclei (Hoechst, gray) and membrane labeling of the lipofected cells (magenta) are shown in (A), (E), (I), and (M). (A–D) Young control lipofected cells reveal infrequent cell division events, while young cells with IGF2b overexpression (E–H) reveal a higher incidence of cell division events, being visible as two neighboring cells immediately abutting each other (E–H, arrows). (M–P) Old control lipofected cells with IGF2b overexpression result in large cells with two nuclei, indicating an incomplete division (arrows in M, N, and P). (Q–W) Brains fixed 5 days after igf2b lipofection also reveal binucleated large cells (arrows in Q, R, and W), visible here in two distinct confocal planes (Q–S and T–V). Some neighboring cells reveal the same phenotype (arrowheads in Q, T, and U). (X) Cells having divided after lipofection were quantified in 6 experiments with a total of 69 young-control, 114 young-igf2b, 64 old-control, and 71 old-igf2b cells. The significance was calculated by a chi-squared test (young, ∗∗∗p = 0.7 × 10⁻³; old, ∗p = 0.01). |
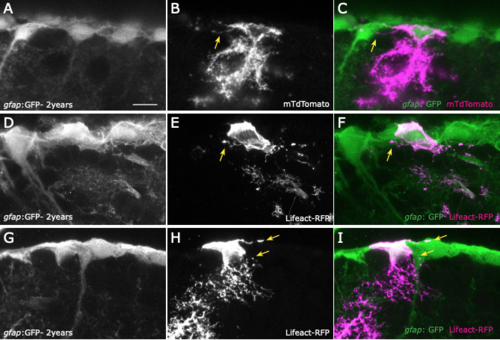
Filopodia on 2-year-old telencephalons. 2-year-old gfap:GFP brains lipofected with membrane bound mTdTomato (A-C) or with Lifeact-RFP (G-I) reveal the presence of filopodia on radial glia with similar sizes and similar numbers as in young brains. J, K: The length and number of filopodia was measured on cells lipofected with a membrane-localized construct (MTdTomato) (3-months and 2-years-old, 15 and 26 cells, respectively) and did not reveal significant differences (T: Mann-Withney test, p=0.42 ; U: Mann-Withney test, p=0.36). |
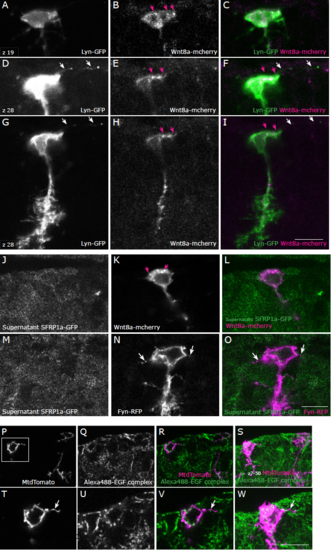
Neither Wnt nor EGF signaling co-localizes with filopodial extensions in adult radial glia. A-I: Example of a cell in a 3-months-old wild-type (AB) brain co-lipofected with pCS2-lyn-GFP and pCS2-wnt8a-mcherry as single confocal planes (z19 in A-C and z28 in D-I). Wnt8a-mcherry localizes in a non- homogeneous manner in the radial glia and can be found at edges of the cytoplasm (pink arrows), however it does not localize in thin filopodial extensions labelled by Lyn-GFP (white arrows). Number of cells analyzed: 8. J-O: The supernatant of Hek-293 cells transfected with sfrp1a-GFP was applied on brain sections containing cells lipofected with pCS2-Wnt8a mcherry (J-L), or with pCS2-fyn-RFP (M-O). The SFRP-GFP protein does not co-localize strongly with Wnt8a-mCherry (pink arrows in K), and does not co-localize with filopodia visible on Fyn-RFP-transfected cells (white arrows in N, O). Number of cells analyzed: 8. P: Staining of a 3-month-old wild-type brain section with the Alexa Fluor 488-EGF complex, which binds to the EGF receptor. Two lipofected cells are visible as a single confocal plane in P-R and as a maximum intensity projection in S. T-W: higher magnification of the inset region depicted in P showing the soma and a filopodial extension (arrow). The EGF-Alexa-488 complex does not co-localize with filopodial extensions. Number of cells analyzed: 12. Scale bars: 10μm. |
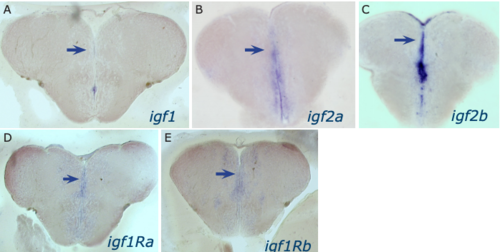
Expression of igf 1, igf2a, igf2b, igf1ra and igf1rb in the adult telencephalon. In situ hybridization was performed on gelatin-albumine frontal sections of adult brains, with antisense probes as indicated in the panels. Expression is detected in the telencephalic ventricular zone (with a stronger expression level in the midline compared to the dorsal surface, where the signal was difficult to detect). |
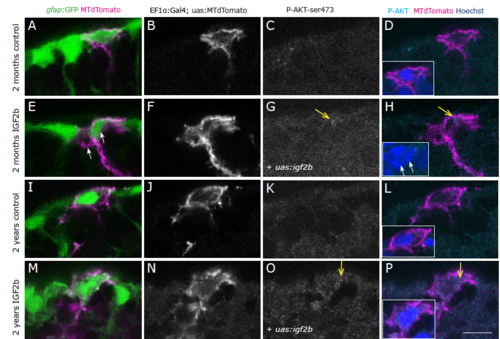
IGF2b overexpression reveals a moderate increase of phospho-Akt immunostaining. Phosphorylated-AKT (Ser473) immunohistochemistry on young (A-H) and old (I-P) brains as a close-up view on the ventricular surface of the pallium. The radial glia somata, located at the border of the ventricle, are labelled in green by the gfap:GFP transgenic line. Single cells stained in magenta have been lipofected in vivo 4 days prior to brain fixation with MTdTomato (control, A-D; I-L) or with MTdTomato and igf2b (IGF2b, E-H; M-P) and are depicted as single confocal plane, highlighting primarily the cell soma (the radial process is not always in the plane of the optical section, therefore not always visible, but it is present below all the somata of lipofected cells). Dots of expression of P-Akt are visible in IGF2b lipofected cells (arrows in G, H, O, P). Insets in D, H, L and P are higher magnifications of the lipofected cells, the nuclei in blue are stained by DAPI. Single confocal planes are displayed, examples are taken out of 3 brains for each condition. Scale bar: 10μm |