
- Title
-
Optical imaging of metabolic dynamics in animals
- Authors
- Shi, L., Zheng, C., Shen, Y., Chen, Z., Silveira, E.S., Zhang, L., Wei, M., Liu, C., de Sena-Tomas, C., Targoff, K., Min, W.
- Source
- Full text @ Nat. Commun.
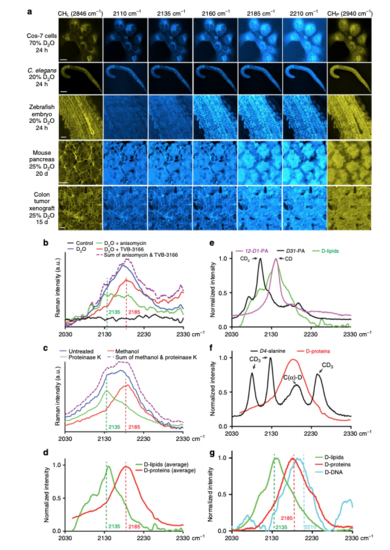
Identification of specific Raman shifts with macromolecular selectivity within the broad C–D vibrational spectra. a SRS microscopic images of various cells and tissues from animals treated with D2O for the indicated amounts of time. Images were collected using previously known Raman shifts for CH-containing lipids (CHL 2846 cm−1) and proteins (CHP 2940 cm−1) and five wavenumbers (2110, 2135, 2160, 2185, and 2210 cm−1) within the C–D broadband. Scale bar = 20 μm. b High wavenumber Raman spectra (2030–2330 cm−1) of Hela cells grown in DMEM made of 70% D2O in the absence or presence of fatty acid synthase inhibitor TVB-3166 or protein synthesis inhibitor anisomycin. Cells grown in DMEM made of 100% H2O were used as control (black). Purple curve shows the sum of the values on the green and red curves. c High wavenumber Raman spectra of deuterium-labeled xenograft colon tumor tissues treated with protease K or washed with methanol for 24 h. Mice bearing the xenograft drank 25% D2O as drinking water for 15 days before tumor tissues were harvested and imaged. d The normalized Raman spectra of tissue after 24 h methanol wash (D-labeled protein signal in red) and the difference spectra before and after methanol wash (D-labeled lipid signal in green), averaged from various mouse tissues. eComparison of Raman spectra of 12-D1-palmitic acid (100 mM dissolved in DMSO), D31-palmitic acid (100 mM in DMSO), and in situ D-labeled lipid standards. fComparison of Raman spectra of D4-alanine (100 mM in PBS) and D-labeled protein standards. Assignments of the peaks were made according to a previous report25. gRaman spectra of biochemically extracted lipids, proteins, and DNA from HeLa cells grown in DMEM media containing 70% D2O |
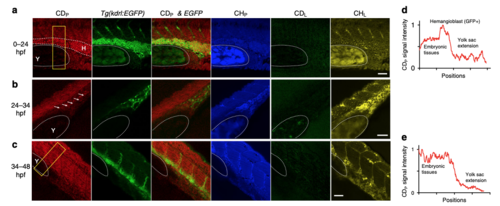
DO-SRS microscopy, in combination with fluorescent labeling, tracks lineage-specific metabolism during zebrafish embryogenesis. a–c SRS microscopic signal and the colocalization with fluorescence from Tg(kdrl::EGFP) reporter in zebrafish embryos that were incubated in egg solution containing 20% D2O from 0 to 24 hpf, from 24 to 34 hpf, or from 34 to 48 hpf. Dashed curves outline the yolk sac extension (labeled as Y) and the GFP-positive hemangioblast (labeled as H) that has strong CDP signal. Arrows point to the GFP-positive cells that are likely differentiating angioblasts in b. d, e Intensity profiles that quantify the CDP signal within the yellow rectangle for 0–24 and 34–48 hpf probing, respectively. x axis shows the position along the length of the box from top to bottom, and y axis shows the average intensity across the width of the box. Scale bar = 20 μm |