
- Title
-
Heat Shock Factor 5 Is Essential for Spermatogenesis in Zebrafish
- Authors
- Saju, J.M., Hossain, M.S., Liew, W.C., Pradhan, A., Thevasagayam, N.M., Tan, L.S.E., Anand, A., Olsson, P.E., Orbán, L.
- Source
- Full text @ Cell Rep.

Characterization of Zebrafish Heat Shock Factor 5 and Generation of hsf5 Mutants Using CRISPR/Cas9-Based Strategy (A) Schematic representation of four members of zebrafish heat shock factor (Hsf) protein family for comparing the relative location of specific domains. For Hsf5, two transcript variants (hsf5_tv1 and hsf5_tv2) are shown. HR, heptad repeat. (B) Phylogenetic analysis of vertebrate heat shock factors showed that all orthologs of zebrafish Hsf5 are located on a separate branch (in bold rectangle) clearly apart from other heat shock factor family members. The tree was constructed with the neighbor-joining method based on the amino acid sequences; we performed a 1000× bootstrapping for a robust comparison. hs, Homo sapiens; mm, Mus musculus; gg, Gallus; xt, Xenopus tropicalis; om, Oncorhynchus mykiss; and dr, Danio rerio (GenBank IDs shown in Table S2). (C) Schematic representation of three mutant lines generated by CRISPR/Cas9 method: Hsf5sg40 has a deletion of five bases, and it introduces a stop codon after 121 amino acids (AA). Hsf5sg41 has a deletion of 7 bases, whereas Hsf5sg42 has an addition of 25 bases, introducing a stop codon after 114 AA and 131 AA, respectively. All three mutations are frameshift type resulting in a truncated protein. (D) Western blot confirmed loss of the C-terminal regions in the mutants. Adult testes from Hsf5sg40 and Hsf5sg41 and WT were used. Actin was used as an internal control; n = 2 biological replicates in each group. (E) Blue Native PAGE analysis using total testicular lysates showed a band of 242 kDa (arrow), suggesting that Hsf5 is present either in oligomeric state or as complexed with other proteins; n = 4 biological replicates. See also Figures S2 and S3 and Tables S2 and S3. |
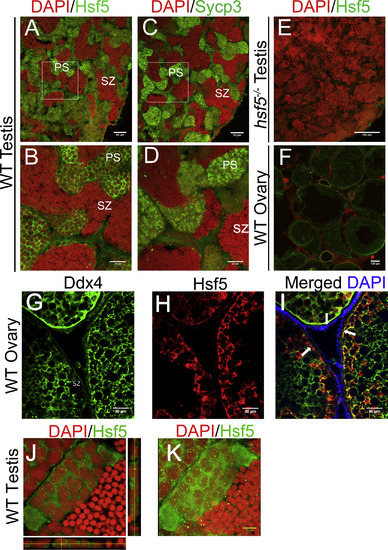
Hsf5 Protein Showed Similar Localization Pattern in Spermatocytes to a Known Spermatocyte Marker Sycp3 (A and B) Representative images show immunostaining with anti-Hsf5 antibodies on adult WT testis sections (B is a zoomed-in image of A). (C and D) Adjacent sections were immunostained with anti-Sycp3 antibodies (D is a zoomed-in image of C), and nuclei were counterstained with DAPI. Strong Hsf5 and Sycp3 signals were detected in spermatocytes, while weak Hsf5 signals were seen in spermatogonia, spermatids and spermatozoa. (E) Immunostaining with anti-Hsf5 antibody did not show significant signals in hsf5−/− testis. (F) Immunostaining suggests low levels of Hsf5 in WT ovary. (G–I) Representative images show immunostaining of adult WT ovaries from tg(ddx4:ddx4-egfp) transgenic zebrafish with anti-Ddx4 (green; G) and anti-Hsf5 (red; H) antibodies, respectively, and merged images showing signals from both antibodies (I). Hsf5 localization pattern follows that of Ddx4 and does not stain the gonadal somatic cells. White arrows indicate the outer layer of oocytes. (J) Localization of Hsf5 protein (green) as granule-like structures in the nucleus of primary spermatocytes; orthogonal views are presented to emphasize the presence of foci in the nucleus (red). (K) Maximum-intensity Z-projection of images. For (A)–(K), n = 3 biological replicates in each group. Scale bars: 50 μm in (A), (C), (G), (H), and (I); 30 μm in (B) and (D); 400 μm in (E); 100 μm in (F); and 5 μm in (G), (H), and (K). See also Figure S4. |
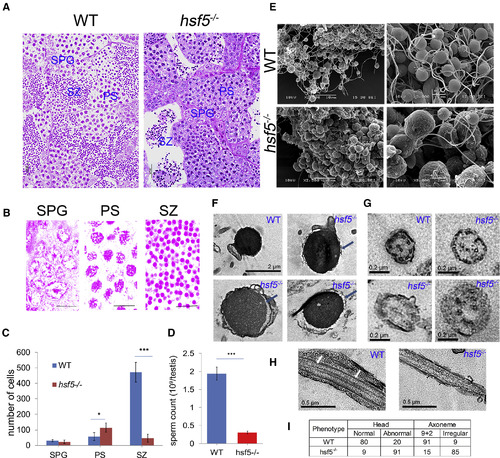
Histological and Electron Microscopic High-Resolution Analysis of Testes and Spermatozoa Revealed Severe Reduction of Sperm Count and Defective Shape of Spermatozoa in hsf5−/− Mutant (A) H&E staining of testicular sections showed severe loss of spermatozoa in hsf5−/− testis lumen, while abundant spermatozoa filled the lumen of WT. (B) Representative germ cell stages: spermatogonia (SPG), primary spermatocyte (PS) and spermatozoa (SZ). (C) Segmentation-based quantification of different cell types using histology images reflected accumulation of primary spermatocyte (PS) and drastic reduction of spermatozoa (SZ) in hsf5−/− testis in comparison to WT. (D) Haemocytometer-based sperm counting reflected severe reduction in the number of spermatozoa in hsf5−/− compared to WT. (E) Comparison of WT (top left and right) and hsf5−/− (bottom left and right) spermatozoa with scanning electron microscope showed clumping of spermatozoa (bottom left) with enlarged head and defective and shorter flagellum (bottom right) in the latter. (F) Comparison of WT and hsf5−/− sperm heads using transmission electron microscopy (TEM) showed the latter with dislocated cytoplasmic membrane (blue arrows) and intense vacuolization. (G) Representative magnified TEM images of cross section through the central region of a WT and hsf5−/− sperm flagella showed severe defects in the organization of axoneme in the latter. (H) Representative magnified TEM images of longitudinal section of WT and hsf5−/− sperm flagella showed severe defects in microtubules of the mutant. Microtubules in WT sperm flagella are marked by white arrows. (I) Quantitation of defects in the head and microtubule arrangements in axonemes of WT and hsf5−/− spermatozoa. For (C) and (D), error bars indicate ± SD; n = 8 biological replicates for (C) and 4 for (D); difference between groups was statistically examined with unpaired two-tailed Student’s t-test; ∗p < 0.05; ∗∗∗p < 0.001. For (E)–(I), n = 4 biological replicates in each group. Scale bars: 20 μm in (A); 10 μm in (B) and (E, left); 2 μm in (E, right) and (F); 0.2 μm in (G); and 0.5 μm in (H). |
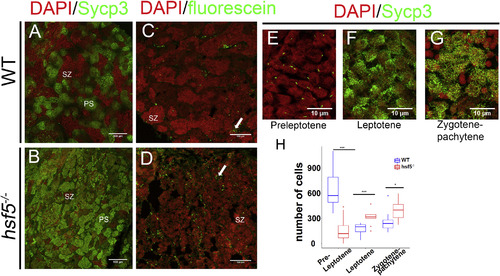
hsf5−/− Testes Showed Higher Number of Primary Spermatocytes and Apoptotic Cells Compared to Wild-Type (A and B) Representative images showing immunostaining of WT (A) and hsf5−/− testis sections (B) with anti-Sycp3 antibody. More spermatocytes were accumulated in the mutant. For (A) and (B), n = 4 biological replicates in each group. (C and D) TUNEL staining of the wild-type (C) and hsf5−/− (D) testis, showed a higher number of apoptotic cells in the latter. n = 3 biological replicates. (E–G) High-resolution confocal images of anti-Sycp3 immunostaining in WT testis showed spermatocytes at different stages of meiotic prophase-1. Sycp3 appears as small particles at one side of the cell in pre-leptotene stage (E), bouquet-shaped chromosomal arrangement in leptotene stage (F), and in reticulate manner at zygotene-pachytene stage (G). (H) Relative proportion of cells in the above three stages quantified from Sycp3-stained WT and hsf5−/− testes. Cell counts at preleptotene stage were significantly lower, whereas those at the leptotene and zygotene-pachytene stages were higher in the mutant compared to WT. For (E)–(H), n = 5 biological replicates in each group. Scale bars: 100 μm in (A)–(D) and 10 μm in (E)–(G). Difference between WT and hsf5−/− was examined with Kolmogorov-Smirnov test, ∗∗p < 0.01. The error bars indicate SD. See also Figure S5. |
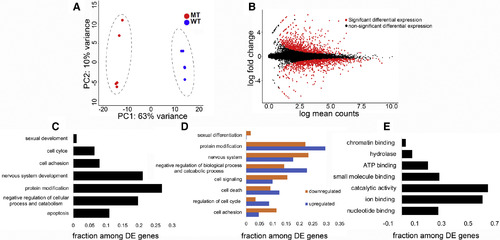
The Transcriptome of hsf5−/− Zebrafish Gonad Is Substantially Different from that of Wild-Type (A) Principal-component analysis (PCA) plot demonstrating the clustering of mutants further away from WT. (B) MA plot representing the differentially expressed genes (DEGs; in red). (C) Enrichment of biological processes among DEGs in hsf5−/− mutant testis, as shown by GO analysis. (D) Representation of enrichment of biological function separately for genes with upregulated and downregulated expression level. (E) Enrichment of genes under molecular function among DEGs in hsf5−/− mutant testis, as shown by GO analysis. n = 5 biological replicates in each group. See also Tables S4 and S5. |