- Title
-
Mutations in Kinesin family member 6 reveal specific role in ependymal cell ciliogenesis and human neurological development
- Authors
- Konjikusic, M.J., Yeetong, P., Boswell, C.W., Lee, C., Roberson, E.C., Ittiwut, R., Suphapeetiporn, K., Ciruna, B., Gurnett, C.A., Wallingford, J.B., Shotelersuk, V., Gray, R.S.
- Source
- Full text @ PLoS Genet.
|
(A-B’) 3D-reconstruction of representative iodine-contrasted μCT dataset from WT (A-A’) and kif6sko mutant zebrafish at 90dpf. (C-D’) 3D-reconstruction and segmentation of virtual endocasting of ventricular system in WT (blue; C-C’) and kif6sko mutant (red; D-D’) zebrafish from datasets in A-B’ demonstrated morphological alterations of the ventricular system including dilation of the central canal (red arrows; D-D’) and stenosis of small ventricles (asterisks, D-D’). (E) Schematic of adult zebrafish brain highlighting the relative transverse optical section of the zebrafish brain in WT (F, H, J) and kif6sko homozygous mutant (G, I, K) zebrafish brain at 90dpf. (F, G) The medial region of the TeO showing the medial TecV (yellow dashed line) which is dilated in kif6sko mutant fish (G) compared to age-matched WT (F). (H, I) Sectioning at the region of the medulla oblongata posterior to the lobus facialis showing dysmorphogenesis and deepening of the posterior RV (yellow dashed line) in kif6sko mutants (I) compared with WT (H) zebrafish. (J, K) Spinal cord sectioning showing dilation of the central canal in kif6sko mutant (K) compared to WT (J) zebrafish. (L) Quantitation of the areas (yellow dashed line) of the TecV and the RV posterior to the lobus facialis (pos. RV) in WT and kif6sko mutant zebrafish, highlighting a consistent dilation in kif6sko mutants (n = 11 sections/genotype; two-tailed t-test; ****, p<0.0001). Scale Bars: 1mm. DiV—diencephalic ventricle; TecV-tectal ventricle TeO-tectum opticum; CCe-corpus cerebelli; RV- rhombencephalic ventricle; Vam—medial division of valvula cerebelli; and Cc-central canal. PHENOTYPE:
|
|
(A-D) Immunofluorescence of Tg[foxj1a::GFP] (A, B) and Tg[foxj1a::Arl13bGFP] transgenic zebrafish in both heterozygous kif6sko/+ (A, C) and homozyogus kif6sko mutant (B, D) zebrafish backgrounds assayed with αGFP (green) and DAPI (nuclei, blue). The Tg[foxj1a::GFP] transgene demonstrates that GFP positive ECs are present in both genotypes. In contrast, kif6sko/+ heterozygous zebrafish display numerous apical tufts of cilia (red arrows; A) projecting into the ventricle lumen, which are markedly reduced in kif6sko mutant zebrafish (B). Similar results were observed with the Tg[foxj1a::Arl13bGFP] transgene, showing a obvious reduction in Arl13b-GFP positive EC axonemes in kif6sko mutant zebrafish (D), which are robustly labeled in kif6sko/+ heterozygous fish (C). Scale Bars: 20μm |
|
Kif6-GFP localizes to the basal bodies and axonemes of Xenopus multi-ciliated cells. Confocal imaging of the mucocilated Xenopus laevis epidermis demonstrating consistent Kif6-GFP localization within the axonemes (green; A, C) and at the basal bodies (green; D, F). Expression of pan-membrane-RFP marker (magenta; B, C) to co-label the axonemes and Centrin-BFP (blue; E, F) to co-label the basal bodies. Scale Bars: 10μm. |
|
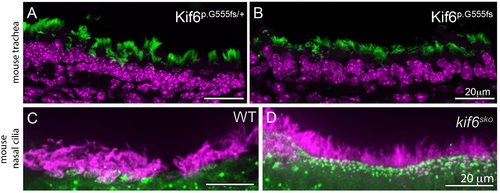
Immunofluorescence (IF) of Kif6 mutant multiciliated tissues in mouse and zebrafish.(A-B) Immunofluorescence of trachea sections in Kif6p.G555fs/+ and Kif6p.G555fs mice showing no apparent cilia defects present in trachea of Kif6 mutant mice. Acetylated tubulin (green) marking cilia, DAPI-stained nuclei (magenta) (C-D) Representative IF of zebrafish nasal pit cilia shows typical cilia in kif6 mutant zebrafish to wildtype counterparts. Acetylated tubulin (magenta) marking cilia, gamma-tubulin marking basal bodies (green). Scale bars are 20μM. PHENOTYPE:
|
|
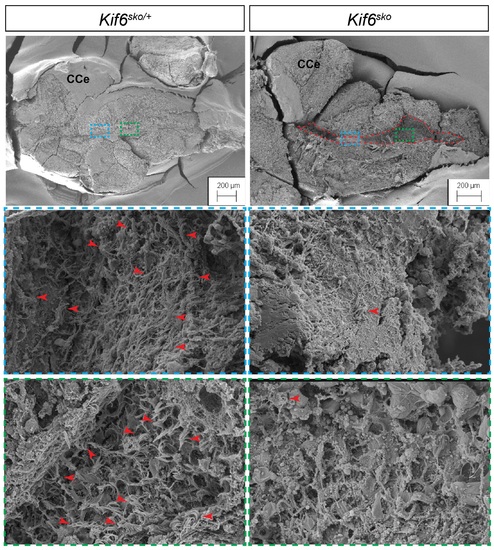
SEM of ventricle in kif6sko mutant zebrafish display dilation of the ventricular system and loss of ependymal cell cilia.Scanning Electron Microscopy of zebrafish brain shows dilation of rhombencephalic (blue box) and telencephalic (green box) ventricles (red dotted line) indicative of hydrocephaly. Higher magnification images reveal loss of ependymal cell cilia tufts (red arrowheads) in kif6 zebrafish mutants when compared with heterozygous counterparts (red arrowheads). Scale bars 20μM and 200μM. (CCe: Cerebellum) PHENOTYPE:
|


