
- Title
-
Stereotypic generation of axial tenocytes from bipartite sclerotome domains in zebrafish
- Authors
- Ma, R.C., Jacobs, C.T., Sharma, P., Kocha, K.M., Huang, P.
- Source
- Full text @ PLoS Genet.
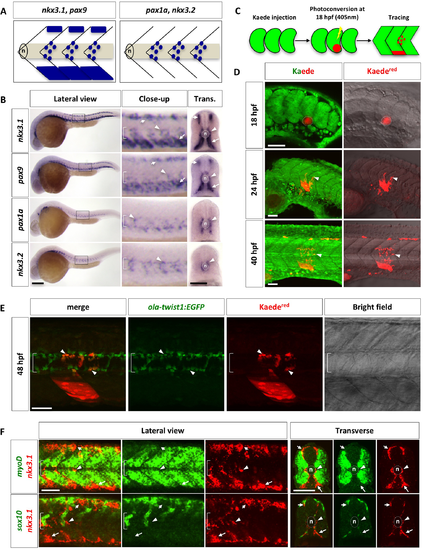
Characterization of the zebrafish sclerotome. (A) Schematic representation of two patterns of sclerotome marker expression. nkx3.1 and pax9 are expressed in both the dorsal and ventral sclerotome domains along with sclerotome derived notochord associated cells. In contrast, pax1a and nkx3.2 are expressed only in sclerotome derived notochord associated cells. Lateral views of three somites are shown with the notochord (n) indicated. (B) Expression of sclerotome markers in wild-type zebrafish at 24 hpf in lateral and transverse (Trans.) views. Close-up images are expanded views of boxed regions in lateral images. nkx3.1 and pax9 are expressed in three regions: a small domain at the dorsomedial edge of the somite (short arrows), a large domain at the ventromedial region of the somite (long arrows), and cells surrounding the notochord (arrowheads). In contrast, pax1a and nkx3.2 are expressed only in cells around the notochord. The notochord (n) is indicated by brackets in close-up views and by dotted lines in transverse views. n = 60 embryos per staining. (C) Schematic drawings of Kaede lineage tracing experiment. Kaedegreen in the presumptive ventral sclerotome of a single somite at 18 hpf was photoconverted to Kaedered and followed over time. (D) Lineage tracing of sclerotome derived cells from the ventral sclerotome domain using Kaede. The presumptive ventral sclerotome domain (indicated by dotted line) was photoconverted to Kaedered at 18 hpf. At 24 hpf, a few sclerotome derived cells (arrowheads) were seen surrounding the notochord. By 40 hpf, many sclerotome derived cells have populated the region surrounding the notochord. n = 35 embryos. (E) Lineage tracing of sclerotome derived cells using Kaede in ola-twist1:EGFP transgenic line. ola-twist1:EGFP embryos were injected with Kaede mRNA at the one-cell stage, and photoconverted in the ventral region of a single somite at 18 hpf as described in (C). At 48 hpf, the red channel was first imaged to identify Kaedered expressing cells, then the Kaedegreen signal was completely photoconverted, and finally, the green channel was imaged in the same z-stack to reveal ola-twist1:EGFP positive cells. Most Kaedered sclerotome derived cells surrounding the notochord are positive for ola-twist1:EGFP (arrowheads). n = 21 embryos. (F) Wild-type embryos were co-labeled with the myotome marker myoD (green, top panel), or the neural crest marker sox10 (green, bottom panel) with nkx3.1 (red). nkx3.1-expressing dorsal sclerotome (short arrows), ventral sclerotome (long arrows), and sclerotome derived notochord associated cells (arrowheads) do not express either myoD or sox10. Images shown are lateral and transverse views of embryo at 24 hpf. n = 30 embryos per staining. Scale bars: (B) 200 μm in lateral views, 50 μm in transverse views; (D, E, F) 50 μm. |
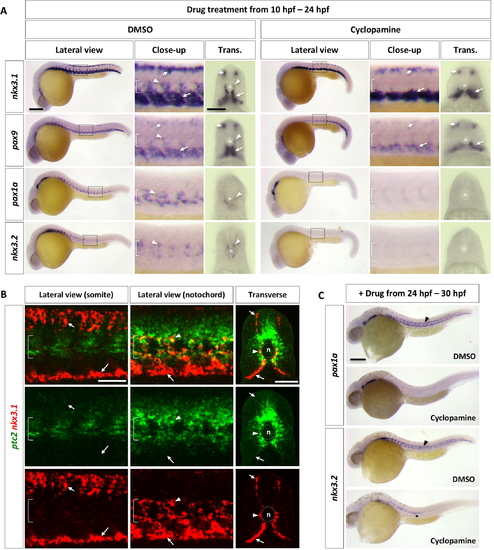
Regulation of the zebrafish sclerotome by Hh signaling. (A) Wild-type embryos were treated with either DMSO or cyclopamine between 10 hpf and 24 hpf, and stained for the expression of nkx3.1, pax9, pax1a, and nkx3.2. The expression of nkx3.1 and pax9 in dorsal and ventral sclerotome domains (short and long arrows, respectively) remained the same upon cyclopamine treatment, while expression of all sclerotome markers was absent in sclerotome derived notochord associated cells (arrowheads). The notochord (n) is indicated by brackets in lateral views and dotted lines in transverse views. n = 45 embryos per condition. (B) Wild-type embryos at 24 hpf were co-labeled with ptc2 (green) and nkx3.1 (red). nkx3.1 expressing dorsal and ventral sclerotome domains (short and long arrows, respectively) do not express ptc2, whereas nkx3.1 expressing cells surrounding the notochord (arrowheads) are positive for ptc2. The confocal plane of the somite shows dorsal and ventral sclerotome domains, while the optical slice near the notochord reveals notochord associated cells and the ventral sclerotome. n = 15 embryos. (C) Wild-type embryos were treated with either DMSO or cyclopamine between 24 hpf and 30 hpf, and stained for the expression of pax1a and nkx3.2 at 30 hpf. pax1a and nkx3.2 expression was absent in sclerotome derived notochord associated cells (arrowheads) upon treatment of cyclopamine. Note that nkx3.2 expression in migrating lateral line cells (asterisk) was not affected. n = 30 embryos per staining. Scale bars: (A, C) 200 μm in lateral views, 50 μm in transverse views; (B) 50 μm. |
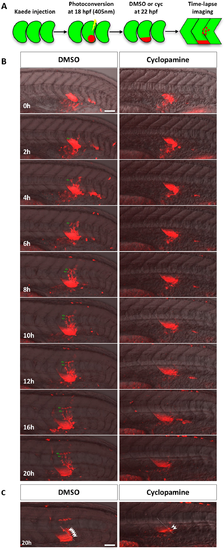
Lineage tracing of sclerotome derived cells. (A) Schematic of the experimental procedure. Embryos were injected with Kaede mRNA at the one-cell stage. At 18 hpf, Kaedegreen in the presumptive ventral sclerotome of a newly formed somite (somite 17 or 18) was photoconverted to Kaedered. At 22 hpf, photoconverted embryos were treated with either DMSO or cyclopamine and imaged over the next 20 hours. (B) Representative snapshots of different time-points during lineage tracing of sclerotome derived cells between 22 hpf (0h) and 42 hpf (20h). Merged images containing the red channel and the bright field are shown. Kaedered sclerotome derived cells in DMSO treated controls migrated from the ventral sclerotome to the notochord before dividing to generate a population of cells surrounding the notochord. Green arrows indicate one representative sclerotome derived cell and its progeny. In the presence of cyclopamine, sclerotome derived cells failed to migrate out of the ventral sclerotome to the notochord. The corresponding movies are shown in S1 and S2 Videos. n = 7 embryos per condition. (C) Projection of deep confocal slices at the last time point of time-lapse. A population of Kaedered cells reminiscent of tenocytes (arrowheads) located along the myotendinous junction between somites (dotted lines). Fewer tenocyte-like cells were found in cyclopamine treated embryos. Scale bars: 50 μm. |
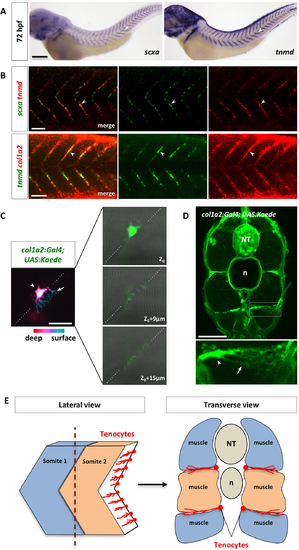
Characterization of zebrafish axial tenocytes. (A) Expression of tenocyte markers scxa and tnmd in wild-type embryos at 72 hpf. Both scxa and tnmd are expressed along the V-shaped myotendinous junction (MTJ) between somites (arrowheads). The complete time course of expression is shown in S6 Fig. n = 30 embryos per staining. (B) Wild-type embryos at 72 hpf were co-labeled with scxa and tnmd (green and red in the top panel, respectively), or tnmd and col1a2 (green and red in the bottom panel, respectively). Overlapping expression between scxa, tnmd, and col1a2 were observed in tenocytes along the MTJ (arrowheads). n = 60 embryos per staining. (C) Mosaic col1a2Kaede embryos at 3 dpf were selected to image individual Kaede+ tenocytes. Color coded depth projection of a single col1a2Kaede tenocyte is shown on the left. The tenocyte cell body (arrowhead) is located deeper (magenta) along the MTJ (dotted lines), whereas its cellular processes (arrow) are projected towards the surface (cyan). Three individual confocal slices of the same tenocyte are shown on the right. The cell body is found near the medial edge of the somite (Z0) and its cellular projections extend through the MTJ (Z0 + 9 μm and Z0 + 15 μm) towards the lateral surface. n = 25 embryos. (D) Cross section view of col1a2Kaede embryos at 5 dpf. An expanded view of a tenocyte in a boxed region is shown at the bottom. The cell bodies of tenocytes (arrowhead) are located at the medial edge of the MTJ, and they extend long cellular projections (arrow) towards the surface of the embryo. n = 28 tenocytes from 15 embryos. (E) Schematic representations of lateral and transverse views of tenocyte organization along the somite boundaries. NT: neural tube; n: notochord. Scale bars: (A) 200 μm; (B) 50 μm; (C) 20 μm; (D) 50 μm. |
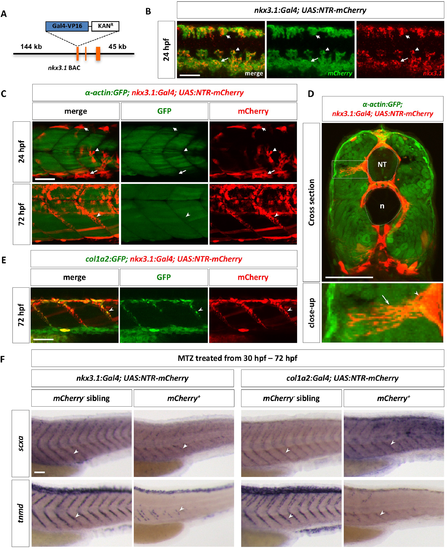
The sclerotome gives rise to axial tenocytes. (A) Schematic representation of the nkx3.1:Gal4 BAC reporter. A cassette containing Gal4-VP16 and Kanamycin resistance gene was recombined to replace the first coding exon of nkx3.1. (B) nkx3.1NTR-mCherry embryos were co-labeled with nkx3.1 (red) and ntr-mCherry (green) at 24 hpf. nkx3.1 and mCherry show overlapping expression in the dorsal sclerotome (short arrows), the ventral sclerotome (long arrows), and sclerotome derived notochord associated cells (arrowheads). n = 30 embryos. (C) The nkx3.1NTR-mCherry line (red) was crossed with the α-actin:GFP line (green) to label muscle cells. At 24 hpf, most mCherry+ cells, including dorsal sclerotome (short arrows), ventral sclerotome (long arrows), and sclerotome derived notochord associated cells (arrowheads), are not α-actin:GFP positive. Note that a few elongated mCherry+ muscle fibers are present in dorsal and ventral region of the somite. By 72 hpf, tenocytes (notched arrowheads) are found along the MTJ between adjacent somites. n = 5 embryos. (D) Cross section views of α-actin:GFP; nkx3.1NTR-mCherry embryos at 72 hpf show tenocytes (arrowheads) near at the medial edge of the somite extending long cellular projections (arrows) towards the surface of the body. The neural tube (NT) and notochord (n) are indicated by the dotted lines. An expanded view of an individual tenocyte in a boxed region is shown. n = 3 embryos. (E) Co-labeling of nkx3.1NTR-mCherry (red) with the col1a2:GFP (green) transgenic reporter at 72 hpf. mCherry+ tenocytes (notched arrowheads) along the MTJ also co-express col1a2:GFP. n = 15 embryos. (F) Embryos from nkx3.1NTR-mCherry or col1a2NTR-mCherry outcrosses were treated with metronidazole (MTZ) from 30 hpf to 72 hpf, and stained for the expression of scxa or tnmd. mCherry+ embryos showed markedly reduced numbers of tenocytes (notched arrowheads) as indicated by scxa or tnmd staining, compared to mCherry- sibling controls. n = 40 embryos per condition. Scale bars: 50 μm. |
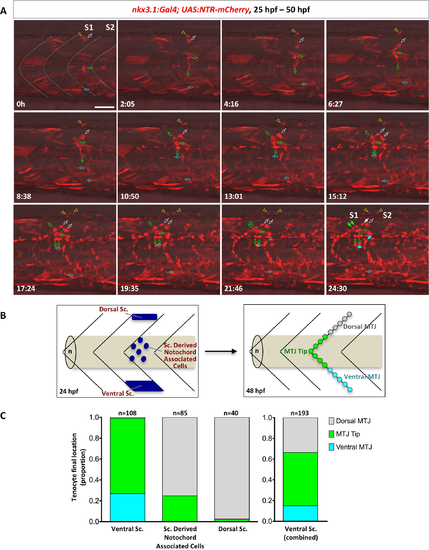
Stereotypic generation of axial tenocytes from different sclerotome domains. (A) Snapshots of time-lapse imaging of an nkx3.1NTR-mCherry embryo between 25 hpf and 50 hpf. Tenocytes were retrospectively traced to determine their cells of origin. Four representative cells (at 0h) from the dorsal sclerotome (2 cells, white arrow and yellow arrowhead), sclerotome derived notochord associated cells (1 cell, green arrow), and the ventral sclerotome (1 cell, cyan arrow) were traced over 25 hours with their daughter cells indicated by the same colored arrows/arrowheads. Based on its initial position, the traced sclerotome derived notochord associated cell was likely derived from the same somite (S1) as the traced dorsal sclerotome cells, whereas the ventral sclerotome cell was from the adjacent posterior somite (S2). Three of the traced cells generated tenocytes along the MTJ (solid arrows) along with several other interstitial cells (open arrows) at the 24.5 hour time frame, whereas one traced dorsal sclerotome cell gave rise to 2 fin mesenchymal cells. The corresponding time-lapse movie is shown in S5 Video. n = 7 embryos. (B) Schematic representation of how tenocytes were quantified based on their origin and positioning along the MTJ. Starting locations of each sclerotome cell at 24 hpf were divided into three compartments: the dorsal sclerotome, the ventral sclerotome, or sclerotome derived notochord associated cells. At 48 hpf, tenocytes were quantified based on their final locations along the “V” of each MTJ: dorsal MTJ (grey, above the notochord), ventral MTJ (cyan, below the notochord), or MTJ tip (green, near the notochord). (C) Quantification of contribution of different sclerotome compartments to axial tenocytes. Tenocytes originated from the ventral sclerotome, sclerotome derived notochord associated cells, or the dorsal sclerotome were graphed based on their final locations along the MTJ. Since sclerotome derived notochord associated cells are derived from the ventral sclerotome, the graph on the right depicts the combined contribution of all cells from the ventral domain. Overall, the dorsal sclerotome mainly gives rise to tenocytes found in the dorsal MTJ, while the ventral sclerotome generates tenocytes along the entire MTJ axis. n = 233 tenocytes from 7 movies. Scale bars: 50 μm. |
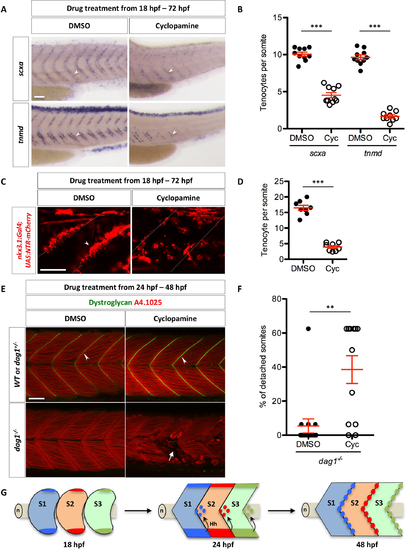
Regulation of tenocytes by Hh signaling. (A) Wild-type embryos were treated with DMSO or cyclopamine between 18 hpf and 72 hpf, and stained for the expression of scxa and tnmd. Expression of both scxa and tnmd in tenocytes (arrowheads) were reduced in the presence of cyclopamine compared to DMSO controls. n = 60 embryos per condition. (B) Quantification of the drug experiment in (A). The numbers of scxa+ and tnmd+ tenocytes along each MTJ were scored and averaged between somite 18 and somite 23 in DMSO/cyclopamine treated embryos. Each data point represents the average number from an individual embryo. Cyclopamine-treated embryos had significantly reduced numbers of scxa+ and tnmd+ tenocytes. n = 10 (DMSO/scxa, Cyc/scxa and DMSO/tnmd) and 9 (Cyc/tnmd) embryos. (C) nkx3.1NTR-mCherry embryos were treated with DMSO or cyclopamine between 18 hpf and 72 hpf, and imaged to visualize tenocytes. Reduced number of tenocytes (arrowhead) along the MTJ (dotted lines) was observed in cyclopamine-treated embryos. n = 20 embryos. (D) Quantification of the drug experiment in (C). The number of tenocytes was quantified similarly as in (B). Cyclopamine-treated embryos had significantly reduced numbers of nkx3.1NTR-mCherry tenocytes. n = 8 embryos per condition. (E) Embryos from a cross between two heterozygous dystroglycan fish (dag1+/-) were treated with either DMSO or cyclopamine from 24 hpf to 48 hpf, and stained for Dystroglycan (green) and myosin heavy chain (A4.1025, red). Dystroglycan was present along the MTJ (arrowheads) in sibling controls but absent in dag1-/- fish. Most DMSO-treated dag1-/- fish had normal muscle attachments despite the loss of Dystroglycan. By contrast, cyclopamine-treated dag1-/- embryos had extensive muscle detachment as evident by the presence of coiled-up fibers (arrow). (F) Quantification of muscle detachment in drug treated dag1-/- embryos shown in (E). dag1-/- fish treated with cyclopamine showed a significant increase in the percentage of somites with detached muscles. n = 15 (DMSO) and 12 (Cyc) embryos. Scale bars: 50 μm. (B, D, F) All data are plotted with mean ± SEM indicated. Statistics: Mann-Whitney U test. Asterisks representation: p-value < 0.01 (**) and p-value < 0.001 (***). (G) Model of axial tenocyte formation in zebrafish. At 18 hpf, the dorsal and ventral domains of the sclerotome are induced independent of Hh signaling. By 24 hpf, cells begin to migrate from the ventral sclerotome and generate a population of cells surrounding the notochord (n). Cells always exit from the posterior end of the ventral somite, and eventually occupy an area around the notochord about one half-somite more posterior to the somite of origin. The migration of sclerotome derived notochord associated cells is dependent on Hh signaling. Hh signaling is subsequently required to maintain sclerotomal marker expression in these cells. By 48 hpf, the MTJ is populated by tenocytes derived from the sclerotome from the anterior somite. Three somites (S1, S2, and S3) corresponding to somite 17–19 are depicted in the model. |
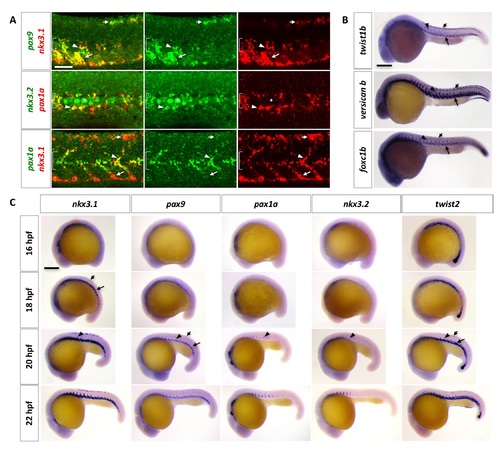
Characterization of the zebrafish sclerotome. (A) Double labeling of sclerotome markers in wild-type zebrafish at 24 hpf. nkx3.1 and pax9 expression overlaps in the dorsal sclerotome domain (short arrows), ventral sclerotome domain (long arrows), and sclerotome derived notochord associated cells (arrowheads). pax1a expression overlaps with nkx3.2 (middle panel) and nkx3.1 (bottom panel) only in the sclerotome derived notochord associated cells. The extent of the notochord is indicated by brackets. Non-specific labeling of notochord cells in nkx3.2 staining is indicated by asterisks. n = 60 embryos per staining. (B) Expression of twist1b, versican b, and foxc1b in wild-type zebrafish at 24 hpf. All 3 markers are expressed in the dorsal sclerotome (short arrows), the ventral sclerotome (long arrows), and sclerotome derived notochord associated cells (arrowheads). n = 15 embryos per staining. (C) Time course analysis of sclerotome marker expression in wild-type zebrafish between 16 hpf and 22 hpf. Expression of nkx3.1 and pax9 begins to appear in the ventral sclerotome domain (long arrows) at 16 hpf and 18 hpf, respectively. By 18 hpf, nkx3.1 is expressed in the dorsal sclerotome domain (short arrows). At 20 hpf, sclerotome derived cells (arrowheads) begin to “sprout” from the ventral domain, coinciding with the expression of pax1a and nkx3.2. Expression of nkx3.1 and pax9 is established in all three domains at this time. twist2 is also expressed in the sclerotome and has a similar timing and expression pattern as nkx3.1 and pax9. n = 30 embryos per staining. Scale bars: (A) 50 μm; (B, C) 200 μm. |
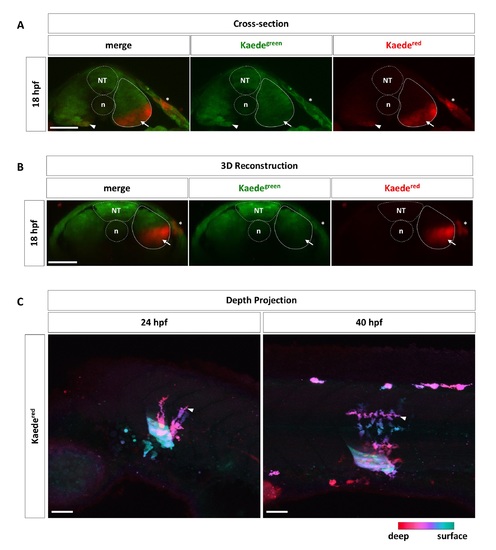
Targeted labeling of the ventral somite by Kaede photoconversion. (A, B) Wild-type embryos injected with Kaede mRNA were photoconverted at 18 hpf in the ventral portion of one single somite, corresponding to the presumptive ventral sclerotome domain, as described in Fig 1C. Embryos (n = 9) were fixed and sectioned to examine the photoconverted region in cross-sections (A). Alternatively, embryos (n = 5) were remounted and imaged from the dorsal side. The resulting confocal stacks were 3D reconstructed to show transverse views of the photoconverted region (B). Strong Kaedered signal (arrows) is restricted to the ventral portion of targeted somites (solid outlines), whereas deeper tissues are only weakly labeled (arrowheads). Note that a small patch of the skin (asterisks), corresponding to the point of laser entry, is also labeled by Kaedered. The neural tube (NT) and notochord (n) are indicated by dotted lines. (C) Corresponding color-coded depth projections of images shown in Fig 1D. At 24 hpf and 40 hpf, most Kaedered cells (arrowheads) are found deeper in the fish compared to the photoconverted ventral somite. Deeper cells are indicated by red/magenta colors, while more superficial cells are represented by green/cyan colors. n = 35 embryos. Scale bars: 50 μm. |
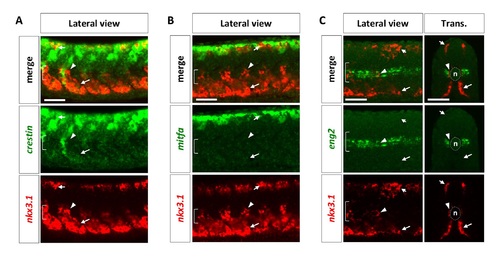
Characterization of the sclerotome. Wild-type embryos at 24 hpf were co-labeled with neural crest markers crestin (A, green), mitfa (B, green), or the muscle pioneer marker eng2 (C, green), with nkx3.1 (red). nkx3.1-expressing dorsal sclerotome (short arrows), ventral sclerotome (long arrows), and sclerotome derived notochord associated cells (arrowheads) do not express either crestin, mitfa, or eng2. The notochord (n) is indicated by brackets in lateral views and dotted lines in transverse views. n = 15 embryos per staining. Scale bars: 50 μm. |
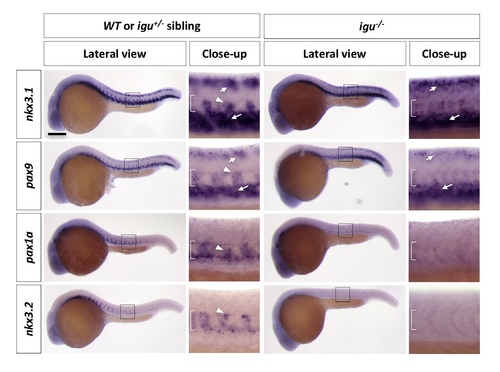
Sclerotome development in iguana (igu-/-) mutants. igu-/- mutants and their sibling controls (wt or igu+/-) were stained with nkx3.1, pax9, pax1a, and nkx3.2 at 24 hpf. In wt or igu+/- controls, nkx3.1 and pax9 are expressed in the dorsal sclerotome domain (short arrows), the ventral sclerotome domain (long arrows), and sclerotome derived notochord associated cells (arrowheads), while pax1a and nkx3.2 are expressed in sclerotome derived notochord associated cells only. In igu-/- mutants, expression of all four sclerotome markers are absent or significantly reduced in sclerotome derived notochord associated cells, while expression of nkx3.1 and pax9 in the dorsal and ventral sclerotome domains remains unchanged. Images shown are lateral views with close-up views of boxed regions. Brackets indicate the location of the notochord. n = 30 embryos per staining. Scale bars: 200 μm. |
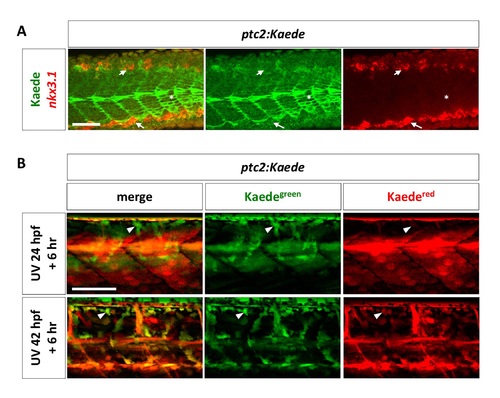
Analysis of Hh response in the sclerotome. (A) ptc2:Kaede transgenic embryos were co-labeled using the nkx3.1 probe (red) and the Kaede antibody (green) at 24 hpf. Neither the dorsal sclerotome domain (short arrows) nor the ventral sclerotome domain (long arrows) labeled by nkx3.1 have overlapping expression with Kaede. ptc2:Kaede expression in slow muscle fibers are indicated by asterisks. n = 15 embryos. (B) ptc2:Kaede embryos were photoconverted at 24 hpf or 42 hpf, and imaged 6 hours later (top and bottom panel, respectively). Kaedegreen signal represents “new” signaling activity within the 6-hour time window, whereas Kaedered signal represents “old” signaling that occurs before the time of photoconversion. ptc2:Kaede expression is present in presumptive sclerotome derived notochord associated cells (arrowheads) at both 30 hpf and 48 hpf. n = 4 embryos per time point. Scale bars: 50 μm. |
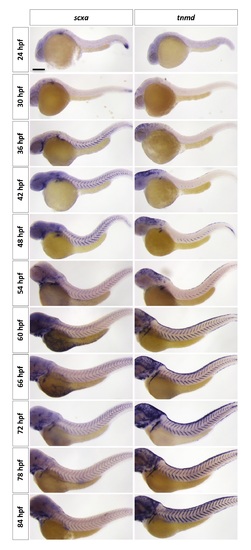
Time-course analysis of tenocyte marker expression in wild-type zebrafish. Expression of scxa and tnmd was analyzed every 6 hours between 24 hpf and 84 hpf. scxa expression appears in the ventral MTJ by 36 hpf and fills the entire “V” of the MTJ by 42 hpf. In contrast, tnmd expression appears at 42 hpf and expression remains restricted to the ventral portion of the MTJ until 60 hpf. From 60 hpf to 84 hpf, both scxa and tnmd expression are present in tenocytes along the entire “V” of the MTJ. Images at 72 hpf are also shown in Fig 4A. n = 15 embryos per staining. Scale bar: 200 μm. |