
- Title
-
Hedgehog signaling regulates cell motility and optic fissure and stalk formation during vertebrate eye morphogenesis
- Authors
- Gordon, H.B., Lusk, S., Carney, K.R., Wirick, E.O., Murray, B.F., Kwan, K.M.
- Source
- Full text @ Development
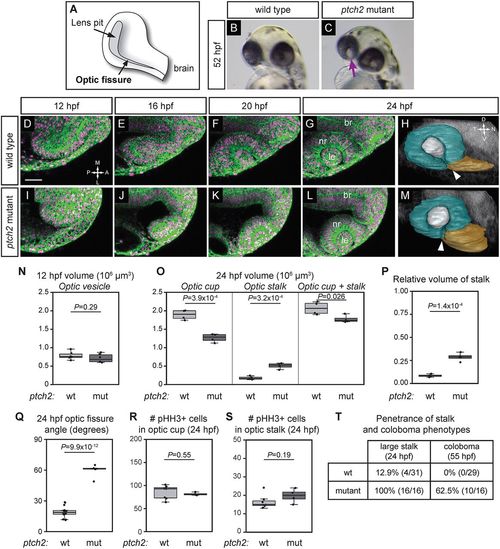
Optic cup morphogenesis and optic fissure and stalk formation are disrupted in the ptch2tc294z mutant. (A) Schematic of optic fissure at optic cup stage, 24 hpf. (B) Wild-type embryo, 52 hpf: the eye is evenly pigmented. (C) ptch2tc294z mutant embryo, 52 hpf: coloboma is apparent as a region of hypopigmentation in the eye (arrow). (D-G,I-L) Wild-type (D-G) and ptch2tc294z mutant (I-L) optic cup formation, single confocal slices from four-dimensional imaging data set (12-24 hpf). Dorsal view. Green, EGFP-CAAX (membranes); magenta, H2A.F/Z-mCherry (nuclei). (H,M) Volume rendering of wild-type (H) and ptch2tc294z mutant (M) embryos, 24 hpf. Lateral view. Teal, optic cup; gray, lens; gold, optic stalk. Arrowhead indicates the optic fissure, which has not formed correctly in the mutant. (N) Optic vesicle volume in wild-type (wt) and ptch2tc294z mutant (mut) embryos, 12 hpf. n=6 for each genotype. (O) Optic cup, stalk, and total volume, 24 hpf. n=4 for each genotype. (P) Relative volume of stalk as a proportion of optic cup+stalk volume. n=4 for each genotype. (Q) Angle measurement of optic fissure opening, 24 hpf. n=16 wt, 5 mut. (R,S) Number of phospho-histone H3-positive cells in the optic cup (R) and stalk (S), 24 hpf. n=7 wt, 4 mut. (T) Comparison of penetrance of large stalk and coloboma phenotypes at 24 and 55 hpf, respectively. (N,O,Q,S) Unpaired Student's t-test. (P,R) Unpaired Welch's t-test to account for unequal variance. br, brain; le, lens; nr, neural retina. RPE is very flattened and difficult to see; thus it is not labeled. Scale bar: 50 µm. EXPRESSION / LABELING:
|
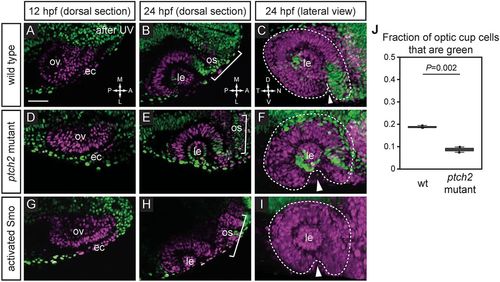
Extended evagination cell movements are disrupted by overactive Hh signaling. (A-I) Wild-type (A-C), ptch2tc294z mutant (D-F) and activated Smo RNA-injected (G-I) embryos subjected to nls-Kaede photoconversion at the optic vesicle stage (A,D,G). The entire optic vesicle was converted from green to red (magenta) fluorescence (along with some ectoderm). (B,E,H) Single confocal sections of optic cups from photoconverted embryos, 24 hpf, dorsal view. (C,F,I) 3D-rendered optic cups, 24 hpf, lateral view. Dashed lines outline the optic cup. Arrowheads indicate the optic fissure. (J) Quantification of extended evagination movements, indicated by the proportion of green nuclei in the optic cup (green nuclei divided by the total number of nuclei) in wild-type (wt) and ptch2tc294z mutant embryos. The proportion of green nuclei in the optic cup is significantly reduced in ptch2tc294z mutants. n=3 wt, 2 mut. Unpaired Student's t-test. ec, ectoderm; le, lens; os, optic stalk; ov, optic vesicle. Scale bar: 50 µm. PHENOTYPE:
|
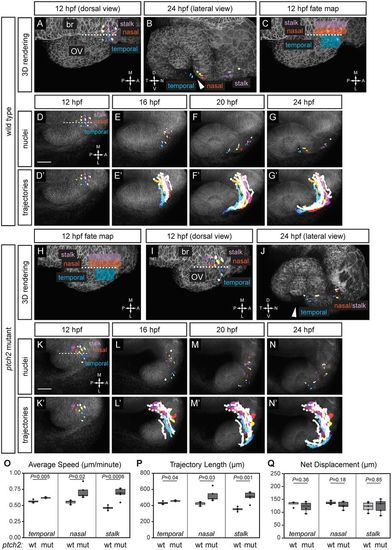
Origins and trajectories of cells contributing to the optic fissure are disrupted in the ptch2tc294z mutant. (A-G′) Wild-type optic fissure and stalk cell movements (12-24 hpf). (A,B) Rendering of nuclei and membrane channel, at 12 hpf, dorsal view (A) and 24 hpf, lateral view (B). (C) Fate map of optic fissure and stalk cells. (D-G) Nuclei over membrane channel average projection. (D′-G′) Trajectories over membrane channel average projection. (H-N′) ptch2tc294z mutant optic fissure cell movements (12-24 hpf). (H) Application of wild-type fate map to ptch2tc294z mutant optic vesicle. (I,J) Rendering of selected nuclei and membrane channel, at 12 hpf, dorsal view (I) and 24 hpf, lateral view (J). Arrowheads in B and J indicate the optic fissure opening. (K-N) Nuclei over membrane channel average projection. (K′-N′) Trajectories over membrane channel average projection. (O-Q) Quantification of cell-tracking data in wild-type (wt) and ptch2tc294z mutant (mut) embryos. n=4 temporal cells, 5 nasal cells, and 5 stalk cells per genotype. (O) Three-dimensional average speed. (P) Three-dimensional trajectory length. (Q) Three-dimensional net displacement. White circles indicate trajectory origins. Blue shades, temporal nuclei; red/yellow shades, nasal nuclei; purple shades, stalk nuclei. Dashed line indicates the boundary between the optic vesicle and the midline region. br, brain; OV, optic vesicle. Scale bars: 50 µm. PHENOTYPE:
|
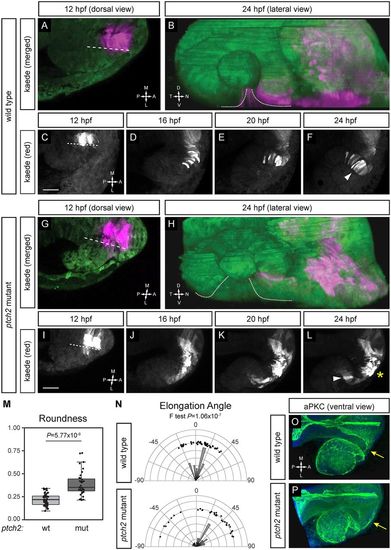
Migratory behaviors of cells contributing to optic fissure formation are disrupted in the ptch2tc294z mutant. (A-F) Wild-type cell movements, cells marked with cytoplasmic Kaede. (A) Merged image of marked cells, 12 hpf, dorsal view. (B) Merged rendering of marked cells, 24 hpf, lateral view. (C-F) Projections from four-dimensional imaging data set of marked cells moving to the ventronasal retina and optic fissure nasal margin. (G-L) Cell movements in the ptch2tc294z mutant. (G) Merged image of marked cells, 12 hpf, dorsal view. (H) Merged rendering of marked cells, 24 hpf, lateral view. (I-L) Projections from four-dimensional imaging data set of marked cells: most cells (asterisk) remain in the optic stalk. (M) Comparison of roundness in wild-type (wt) and ptch2tc294z mutant (mut) embryos (unpaired Welch's t-test to account for unequal variance). n=49 cells from 18 embryos for wt; 35 cells from 11 embryos for mut. (N) Comparison of elongation angle in wild-type (wt) and ptch2tc294z mutant (mut) embryos (F-test to determine the probability that the variances are not significantly different). n=49 cells from 18 embryos for wt; 35 cells from 11 embryos for mut. (O,P) aPKC antibody staining in wild-type (O) and ptch2tc294z mutant (P) embryos, 24 hpf, ventral view. No gross defects in apicobasal polarity in ptch2tc294z mutants are apparent. Yellow arrows indicate the optic stalk. Dashed lines indicate the boundary between optic vesicle and midline region. Dotted lines indicate optic fissure margins. Arrowheads indicate bipolar cells; asterisk indicates cells with an aberrant morphology. Scale bars: 50 µm. EXPRESSION / LABELING:
PHENOTYPE:
|
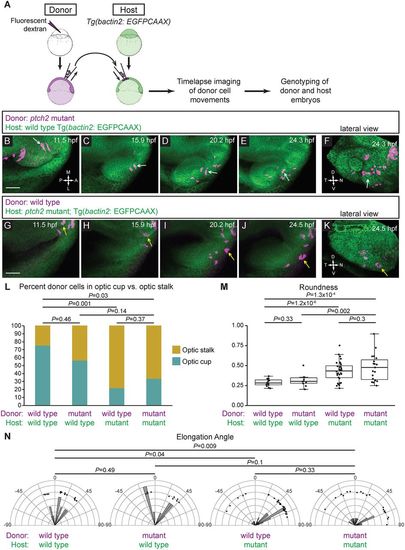
ptch2tc294z acts in a non-cell-autonomous manner to disrupt cell movements. (A) Schematic of cell-transplantation approach. Cells were transplanted from donor to host at blastula stages, and time-lapse microscopy performed on embryos in which transplanted cells were in the prospective optic fissure forming region at 12 hpf. After imaging, both donor and host embryos were genotyped. (B-F) Transplantation of ptch2tc294z mutant cells into a wild-type host. (B-E) Mutant cells exhibit an elongated morphology, move out of the midline region, through the optic stalk, and into the optic cup, where a mutant donor cell contributes to the optic fissure (white arrows). (F) Lateral view of 3D rendering, final time point. White arrow marks a cell that contributes directly to the optic fissure margin. (G-K) Transplantation of wild-type cells into a ptch2tc294z mutant host. (G-J) Wild-type cells move out of the midline region; few cells move to the central retina within the optic cup. Most cells become less elongated and reside in the optic stalk region (yellow arrows). (K) Lateral view of 3D rendering, final time point. Yellow arrow marks cells that arose from the prospective optic cup/fissure region, but contribute to the optic stalk. (L-N) Quantification of transplantation results. n=14 cells (wt into wt); 10 cells (mut into wt); 32 cells (wt into mut); and 19 cells (mut into mut). (L) Proportions of transplanted cells contributing to optic stalk (gold) or optic cup/fissure (teal). Fisher's exact test. (M) Roundness of transplanted cells: morphology reflects host genotype. Unpaired Welch's t-test to account for unequal variance. (N) Elongation angle of transplanted cells. F-test to determine the probability that the variances are not significantly different. Scale bars: 50 µm. |
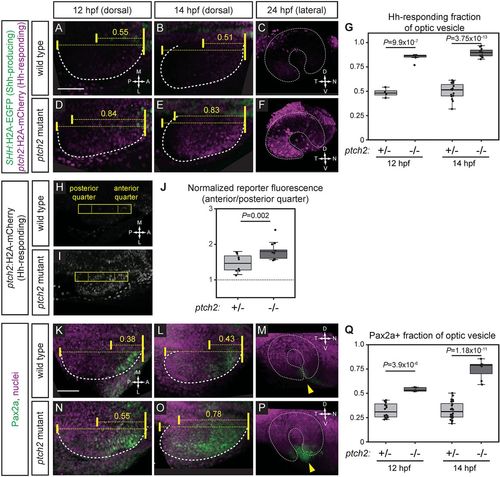
Hedgehog signaling is increased at early optic vesicle stages in the ptch2tc294z mutant. (A-G) Hh signaling reporter expression is expanded in the ptch2tc294z mutant at 12, 14 and 24 hpf. Embryos are labeled for Shh-producing cells [green; Tg(SHH:H2A-GFP)z205] and Hh-responding cells [magenta; Tg(GBS-ptch2:H2A-mCherry)z206]. (A-C) Wild-type double transgenic. (D-F) ptch2tc294z mutant double transgenic. (G) Quantification of the anterior-posterior fraction of the optic vesicle occupied by reporter-positive cells. n=4 wt, 6 mut at 12 hpf; 15 wt, 11 mut at 14 hpf. (H-J) Hh signaling reporter expression [Tg(GBS-ptch2:H2A-mCherry)z206] is upregulated in the ptch2tc294z mutant at 13 hpf. A rectangle (44 pixels wide) spanning the anterior-posterior length of the optic vesicle was drawn. Fluorescence intensity in the anterior quarter was normalized to the posterior quarter. A value of 1 (J, dotted line) represents equal fluorescence intensity in the quarters. (H) Wild-type transgenic. (I) ptch2tc294z mutant transgenic. (J) Normalized fluorescence intensity. n=8 wt, 13 mut. (K-Q) Endogenous Hh target gene expression (Pax2a) is expanded in the ptch2tc294z mutant at 12, 14 and 24 hpf. Antibody staining performed for Pax2a (green), nuclei counterstained with TO-PRO-3 (magenta). (K-M) Wild type. (N-P) ptch2tc294z mutant. Yellow arrowheads indicate the optic fissure. (Q) Quantification of the anterior-posterior fraction of optic vesicle occupied by Pax2a-positive cells. Unpaired Student's t-tests. n=16 wt, 5 mut at 12 hpf; 24 wt, 7 mut at 14 hpf. Dashed lines indicate border of optic vesicle. Dotted lines indicate border of optic cup. Yellow brackets indicate anterior-posterior extents of the optic vesicle and either reporter expression or Pax2a staining. The number above indicates the fraction of the optic vesicle occupied by the reporter expression or Pax2a staining. Scale bars: 50 µm. EXPRESSION / LABELING:
PHENOTYPE:
|
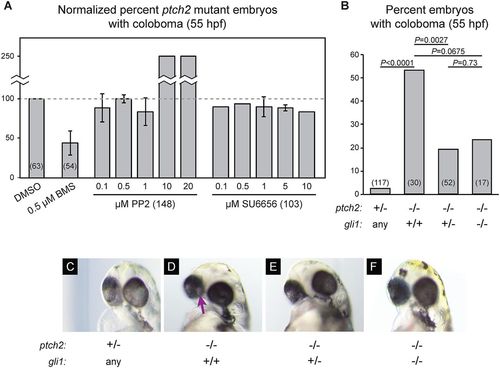
Canonical signaling via Gli1 is required for coloboma in the ptch2tc294z mutant. (A) Inhibition of non-canonical Hh signaling via Src-family kinases (SFKs) does not rescue coloboma in the ptch2tc294z mutant. Graph shows percentage of ptch2tc294z mutant embryos with coloboma, normalized to the DMSO control group. (B) Genetic loss of one or both copies of gli1 (using gli1ts269) partially rescues the coloboma phenotype in the ptch2tc294z mutant. Percentage of embryos with coloboma is shown. Numbers in parentheses indicate n. (C-F) Representative images of embryos from the genetic experiments shown in B, 55 hpf. (C) ptch2+/−; gli1any. (D) ptch2−/−; gli1+/+. (E) ptch2−/−; gli1+/−. (F) ptch2−/−; gli1−/−. Arrow indicates coloboma. PHENOTYPE:
|
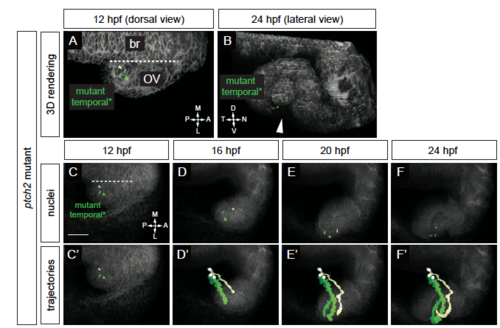
Origin and movement of cells contributing to the temporal optic fissure margin in the ptch2tc294z mutant. (A-F’) ptch2tc294z mutant temporal optic fissure cell movements (12-24 hpf). (A) Rendering of nuclei and membrane channel, 12 hpf, dorsal view. (B) Rendering of nuclei and membrane channel, 24 hpf, lateral view. (C-F) Nuclei over membrane channel average projection. (C’-F’) Trajectories over membrane channel average projection. Cells execute a novel trajectory. Scale bar, 50 μm. PHENOTYPE:
|
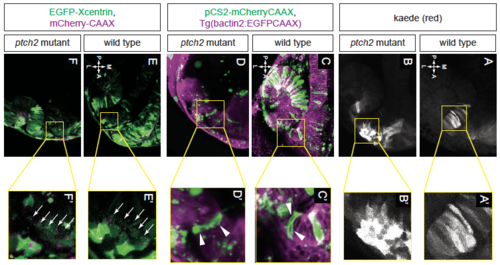
Single cell morphologies and cell polarity. EXPRESSION / LABELING:
|
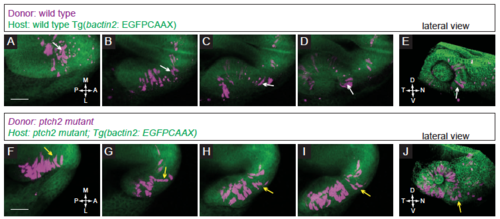
Localization and movement of transplanted cells in control conditions. (A-E) Transplantation of wild type donor cells into a wild type host. (A-D) Donor cells move out of the midline region, through the prospective optic stalk, and into the optic cup. Note the bipolar, elongated morphology of the cell contributing to the nasal optic fissure (white arrows). (E) Lateral view of 3D rendering of final timepoint. (F-J) Transplantation of ptch2tc294z mutant donor cells into a ptch2tc294z mutant host. (F-I) Many donor cells in this movie start already within the optic vesicle. Following cells that emerge from the midline region, some cells exhibit and maintain this morphology through the optic stalk and into the optic cup. Other cells (yellow arrows) lose their bipolar morphology and contribute to the optic stalk. (J) Lateral view of 3D rendering of final timepoint. Scale bar, 50 μm. |