
- Title
-
Vangl2-dependent regulation of membrane protrusions and directed migration requires a fibronectin extracellular matrix
- Authors
- Love, A.M., Prince, D.J., Jessen, J.R.
- Source
- Full text @ Development
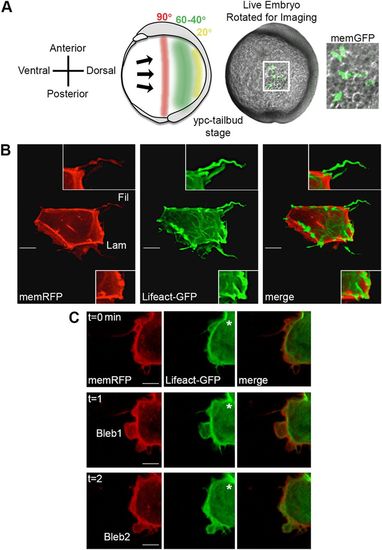
Time-lapse imaging of membrane protrusions. (A) Schematic (left) and live wild-type zebrafish embryo (right) highlighting the 40°-60° lateral region that was analyzed. Lateral ectodermal cells with mosaic memGFP expression from an embryo used for confocal imaging at 60° from dorsal (white boxed area, enlarged far right). ypc, yolk-plug closure. (B) Wild-type ectodermal cell expressing memRFP and Lifeact-GFP with filopodia (Fil) and large lamellipodia-like (Lam) membrane protrusions. Insets show enlarged images of protrusion classifications. (C) Wild-type ectodermal cell undergoing division. Asterisks indicate forming cleavage furrow. Two blebs are observed during the three time points. Scale bars: 5 µm. |
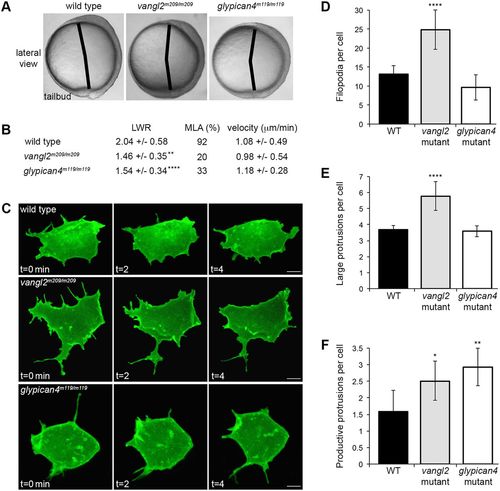
Membrane protrusion formation in vangl2 and glypican4 mutant embryos. (A) Live embryo images at late yolk-plug closure/tailbud stage. Black lines denote the polster-tailbud angle. (B) PCP and migration velocity quantitation in the ectoderm. LWR and MLA values were obtained from: wild type (WT), n=50 cells, 13 embryos; vangl2m209/m209, n=10 cells, 8 embryos; glypican4m119/m119, n=49 cells, 5 embryos. PCP data for vangl2 mutant ectoderm was previously published (Jessen et al., 2002), which explains the lower n. (C) Time-lapse confocal images of ectodermal cells expressing memGFP over three time points. (D-F) Quantitation of the total numbers of filopodia (D), large protrusions (E) and productive protrusions (F) formed by WT (n=12 cells, 8 embryos), vangl2m209/m209 (n=10 cells, 7 embryos) and glypican4m119/m119 (n=12 cells, 5 embryos). Data are mean±s.d. *P<0.05, **P<0.01, ****P<0.0001; P values are versus WT; one-way ANOVA significance test followed by Tukey HSD post-hoc tests. Scale bars: 5 µm. |
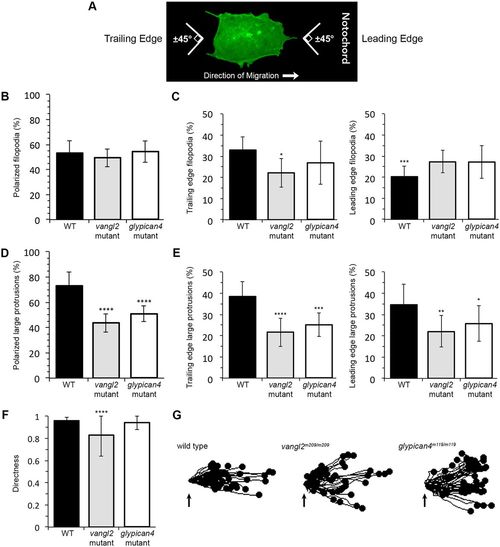
Membrane protrusion polarity and directed migration in vangl2 and glypican4 mutant embryos. (A) Wild-type (WT) ectodermal cell image illustrating polarized protrusion angles. (B,C) Quantitation of the total percentages of polarized filopodia (B) and filopodia localized at the leading versus trailing edge (C) in WT (n=11 cells, 8 embryos), vangl2m209/m209 (n=10 cells, 7 embryos) and glypican4m119/m119 (n=11 cells, 5 embryos). (D,E) Quantitation of polarized large protrusions (D) and large protrusions localized at the leading versus trailing edge (E) in WT (n=12 cells, 8 embryos), vangl2m209/m209 (n=10 cells, 7 embryos) and glypican4m119/m119 (n=12 cells, 5 embryos). (F) Directed migration values in WT (n=50 cells, 11 embryos), vangl2m209/m209 (n=51 cells, 13 embryos) and glypican4m119/m119 (n=50 cells, 8 embryos). (G) Schematic of the migration paths of individual ectodermal cells. Origins (arrows) standardized for comparison. Dorsal is to the right. Data are mean±s.d. *P<0.05, **P<0.01, ***P<0.001, ****P<0.0001; P values are versus WT, except WT leading edge P value which is versus WT trailing edge; one-way ANOVA significance test followed by Tukey HSD post-hoc tests. |
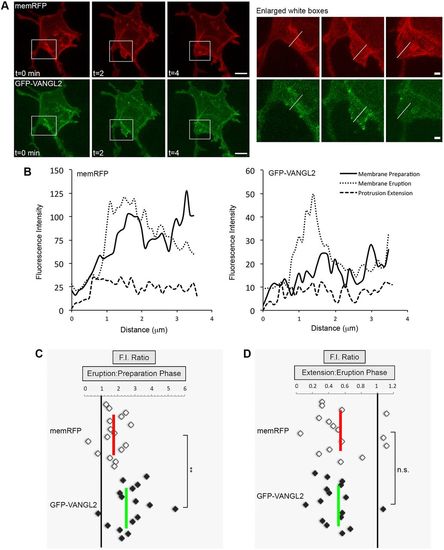
Increased Vangl2 expression in forming membrane protrusions. (A) Time-lapse confocal images of wild-type lateral ectodermal cells expressing memRFP and GFP-VANGL2 (three time points shown). White boxes highlight a forming large protrusion (enlarged images on the right; white lines approximate the regions analyzed). (B) Plot profiles of fluorescence intensity (F.I.) across the plasma membrane of an individual large protrusion expressing memRFP (left) and GFP-VANGL2 (right) before protrusion formation (preparation), after formation (eruption) and during extension. (C,D) memRFP and GFP-VANGL2 F.I. ratios for individual large protrusions [eruption phase/preparation phase (C), n=16 protrusions, 6 embryos; extension phase/eruption phase (D), n=16 protrusions, 6 embryos]. Vertical red and green lines indicate the averages. **P<0.01; two-tailed paired t-test. n.s., not significant. Scale bars: 5 µm in A, left; 1 µm in A, right. |
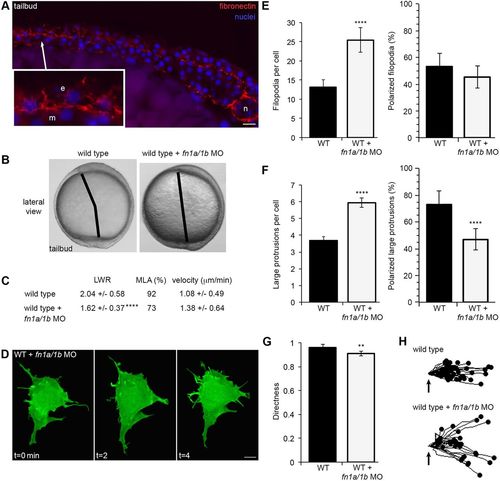
Fibronectin regulates membrane protrusion dynamics. (A) Cryosection through the dorsolateral region of a wild-type (WT) tailbud-stage embryo showing fibronectin and nuclei. Inset shows an enlarged image illustrating the relationship between ECM, ectodermal (e) and mesodermal (m) cells. n, notochord. (B) Live embryo images at late yolk-plug closure/tailbud stage in WT and fn1a/1b morpholino (MO)-injected WT embryos. Black lines denote the polster-tailbud angle. (C) PCP and migration velocity quantitation of ectodermal cells. LWR and MLA values were obtained from: WT, n=50 cells, 13 embryos; fn1a/1b MO-injected WT, n=48 cells, 10 embryos. (D) Representative ectodermal cell expressing memGFP over three time points from time-lapse data. (E,F) Quantitation of the average total number (left) and the total percentage of polarized (right) filopodia (E) and large protrusions (F) in WT (n=12 cells, 8 embryos) and fn1a/1b morphant (n=10 cells, 7 embryos) embryos. (G) Directed migration values in WT (n=50 cells, 11 embryos) and fn1a/1b morphants (n=32 cells, 10 embryos). (H) Schematic of the migration paths of individual ectodermal cells. Origins (arrows) standardized for comparison. Dorsal is to the right. Data are mean±s.d. **P<0.01, ****P<0.0001; P values are versus WT; two-tailed unpaired t-test. Scale bars: 20 µm in A; 5 µm in D. |

Fibronectin is required for cell-surface Vangl2 expression. (A,C) Zebrafish Vangl2 protein expression in wild type and fn1a/1b morpholino (MO)-injected tailbud-stage embryos without (left) and with (right) DAPI nuclear labeling. Immunofluorescence labeling of Vangl2 in the ectoderm (A) and mesoderm (C). (B,D) Representative plot profiles showing average fluorescence intensities across single ectodermal cells in wild type (n=30 cells, 3 embryos) and fn1a/1b morphant embryos (n=30 cells, 3 embryos) in ectoderm (B) and mesoderm (D). Scale bars: 5 µm. |
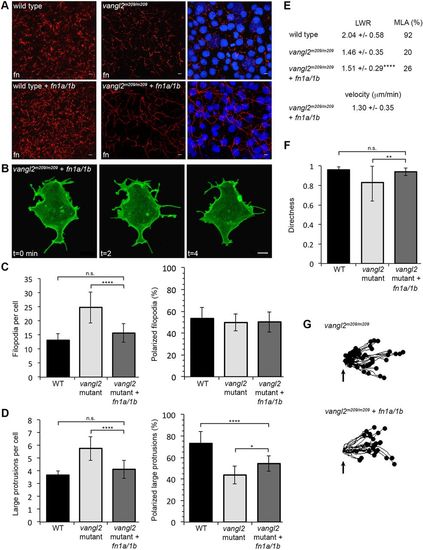
Fibronectin expression rescues the vangl2 membrane protrusion phenotype but not PCP. (A) Fibronectin expression in tailbud-stage wild type (WT) and vangl2m209/m209 mutant control embryos (top) or WT and mutant embryos injected with fn1a/1b synthetic mRNA (bottom). Nuclei labeled with DAPI (right). fn, fibronectin. (B) Representative ectodermal cell expressing memGFP over three time points from time-lapse data. (C,D) Quantitation of the average total number of protrusions and the total percentage of polarized protrusions in WT (n=12 cells, 8 embryos), vangl2m209/m209 mutant control embryos (n=10 cells, 7 embryos) and vangl2m209/m209 mutants injected with fn1a/1b mRNA (n=10 cells, 7 embryos). (E) PCP quantitation in the ectoderm. LWR and MLA values obtained from: vangl2m209/m209 PCP and migration velocity quantitation in the ectoderm. LWR and MLA values were obtained from: WT, n=50 cells, 13 embryos; vangl2m209/m209, n=10 cells, 8 embryos; fn1a/1b-injected vangl2m209/m209 mutants, n=50 cells, 8 embryos. (F) Directed migration values in WT (n=50 cells, 11 embryos), vangl2m209/m209 (n=51 cells, 13 embryos) and fn1a/1b-injected vangl2m209/m209 mutants (n=26 cells, 8 embryos). (G) Schematic of the migration paths of individual ectodermal cells. Origins (arrows) standardized for comparison. Dorsal is to the right. Data are mean±s.d. *P<0.05, **P<0.01, ****P<0.0001; P values are versus WT, except where indicated on the graphs; one-way ANOVA significance test followed by Tukey HSD post-hoc tests. n.s., not significant. Scale bars: 5 µm. |
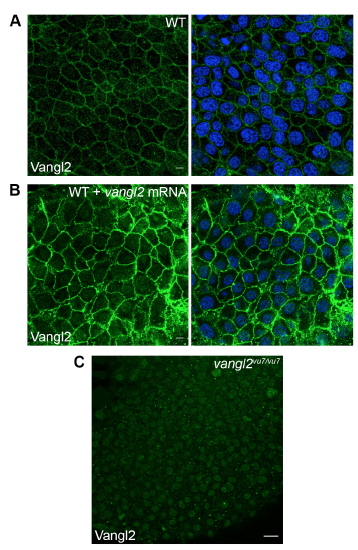
Zebrafish Vangl2 polyclonal antibody validation and Vangl2 overexpression. (A) Immunofluorescence labeling of endogenous Vangl2 protein expression in wild-type (WT) tailbud stage embryo (right panel, nuclei labeled with DAPI). (B) Vangl2 expression in a wild-type embryo injected with 200 pg synthetic vangl2 mRNA (right panel, nuclei labeled with DAPI). (C) Endogenous Vangl2 expression in a tailbud stage vangl2vu7/vu7 mutant embryo. Only background fluorescence from the secondary antibody is visible. Scale bars: 5 μm in panels A and B; 20 μm panel C. |
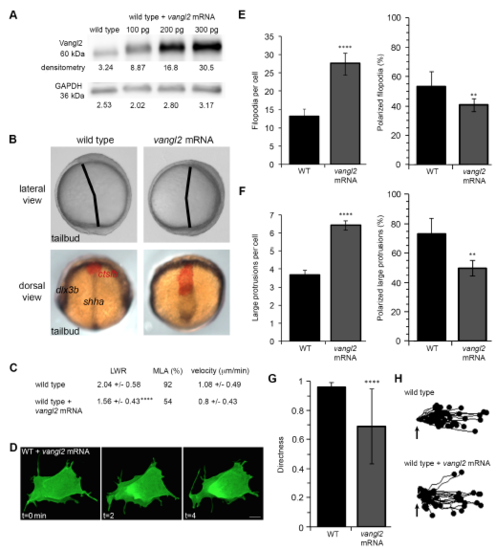
Vangl2 overexpression disrupts PCP and membrane protrusion dynamics. (A) Western blot of Vangl2 protein expression in vangl2 mRNA-injected wild-type (WT) embryos. Raw unmodified densitometry values are shown. (B) Upper panels, live images of late yolk-plug closure/tailbud stage embryos. Black lines denote the polster-tailbud angle. Lower panels, whole-mount in situ hybridizations performed using antisense RNA probes labeling the neural/non-neural ectoderm boundary (dlx3b), midline (shha), and prechordal mesendoderm (ctslb). (C) PCP and migration velocity quantitation in the ectoderm. LWR and MLA values were obtained from: wild type n values are as in Fig. 2; vangl2-injected wild type n=50 cells, 9 embryos. (D) Representative ectodermal cell expressing memGFP over three time points from time-lapse data. (E,F) Quantitation of the average total number of protrusions and the total percentage of polarized protrusions in wild type (n values are as in Figs 2 and 3) and vangl2-injected wild-type embryos (n=10 cells, 7 embryos). (G) Directed migration values (wild type n values are as in Fig. 3; vangl2-injected n=43 cells, 9 embryos). (H) Schematic representations of the migration paths of individual ectodermal cells. Origins (arrows) standardized for comparison. Dorsal is to the right. Average values are shown ± standard deviation. **P<0.01, ****P<0.0001; P values are versus wild type; two-tailed unpaired t-test. Scale bar, 5 μm. |
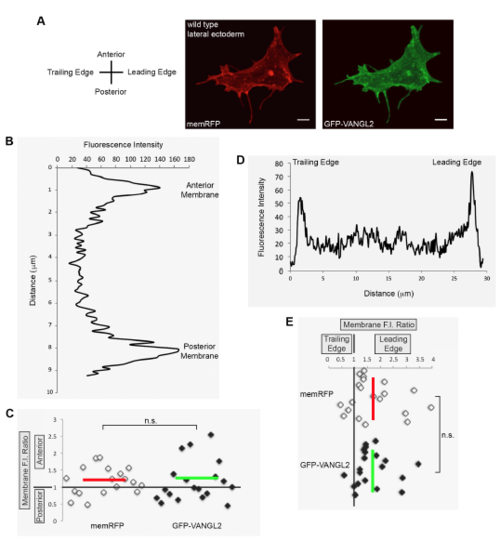
Vangl2 expression in polarized migrating gastrula cells. (A) Tailbud-1-somite stage wild-type lateral ectodermal cells injected with memRFP and GFP-VANGL2 synthetic mRNA. (B,D) Plot profiles of fluorescence intensity (F.I.) across the anterior/posterior (B) and leading edge/trailing edge (D) axes of single ectodermal cells. (C,E) memRFP and GFPVANGL2 anterior/posterior (C) and leading edge/trailing edge (E) membrane F.I. ratios for individual lateral ectodermal cells (anterior/posterior n=18 cells, 15 embryos; leading edge/trailing edge n=20 cells, 15 embryos). Horizontal and vertical red and green lines indicate averages. n.s. not significant; two-tailed paired t-test. Scale bars, 5 μm. |
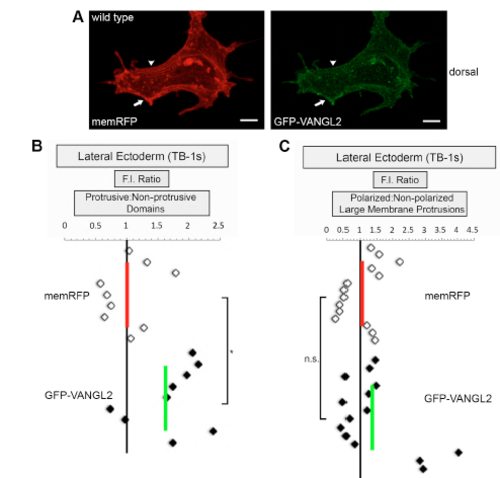
GFP-VANGL2 localization in protrusive and non-protrusive membrane domains. (A) Lateral ectodermal cell labeled with memRFP and GFP-VANGL2. Arrows denote a forming non-polarized large protrusion. Arrowheads show a non-protrusive membrane domain. memRFP and GFP-VANGL2 fluorescence intensity (F.I.) ratios for (B) protrusive/non-protrusive membrane domains (n=9 protrusions, 6 embryos) and (C) polarized/non-polarized large protrusions (n=14 protrusions, 5 embryos). Vertical red and green lines indicate the averages. *P<0.05, n.s. not significant; two-tailed paired t-test. Scale bars, 5 μm. |
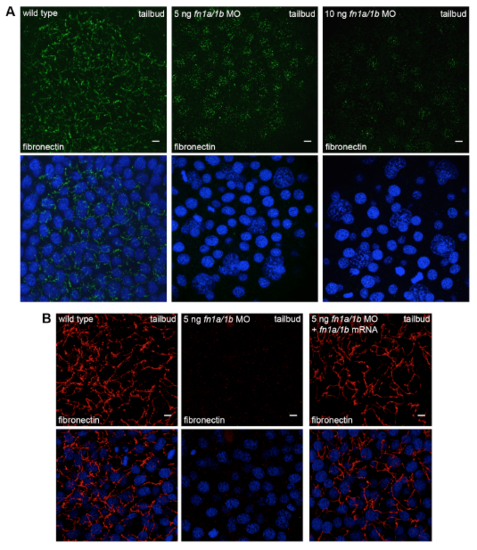
Morpholino knockdown disrupts fibronectin expression and fibrillogenesis. (A) Immunofluorescence labeling of fibronectin expression in tailbud stage wild-type embryo and wild-type embryos injected with either 5 ng or 10 ng of each fibronectin morpholino (MO). (B) Injection of fn1a/1b synthetic mRNA rescues the fn1a/1b morpholino ECM phenotype. Bottom images in (A) and (B) show DAPI-labeled nuclei. Scale bars, 5 μm. |
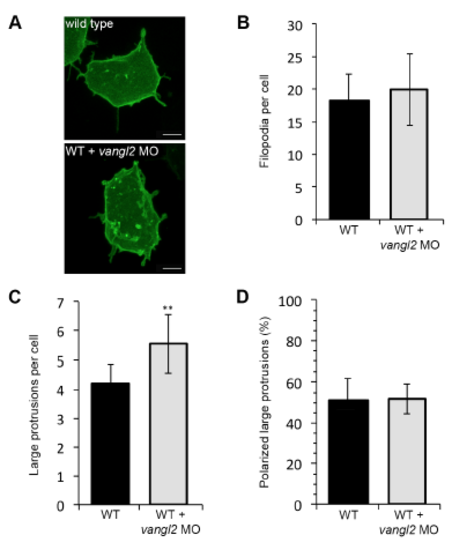
Wild type and vangl2 morphant membrane protrusive activity at midgastrulation. (A) Time-lapse confocal images of 80% epiboly epiblast cells expressing memGFP. WT, wild type. (B,C) Quantitation of the total numbers of membrane protrusions formed by wild type (n=9 cells, 7 embryos) and wild-type embryos injected with vangl2 morpholino (MO) (n=10 cells, 6 embryos). (D) Quantitation of the total percentage of polarized large protrusions. Average values are shown ± standard deviation. **P<0.01; P values are versus wild type; two-tailed unpaired t-test. Scale bars, 5 μm. |
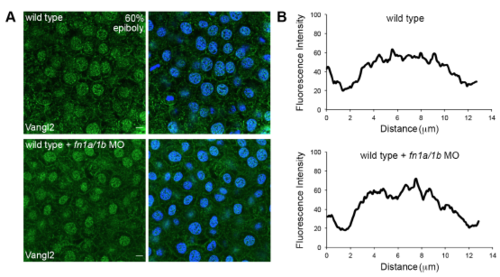
Fibronectin is not required for Vangl2 expression at 60% epiboly. (A) Immunofluorescence labeling of Vangl2 protein expression in wild type and fn1a/1b morpholino (MO)-injected wild-type embryos without (left panels) and with (right panels) DAPI nuclear labeling. (B) Representative plot profiles showing the average fluorescence intensities across single epiblast cells in wild type (n=30 cells, 3 embryos) and fn1a/1b morphant embryos (n=30 cells, 3 embryos). Scale bars, 5 μm. |
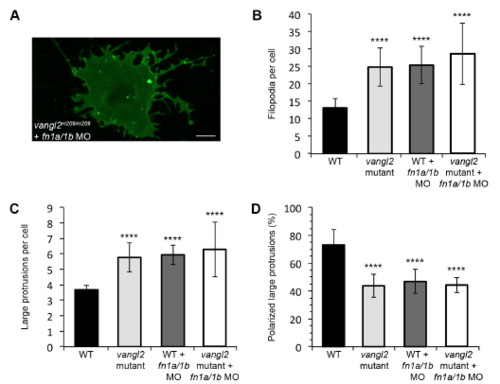
Knockdown of fibronectin in vangl2 mutant embryos. (A) Time-lapse confocal image of late gastrula stage cell expressing memGFP. vangl2 mutant embryo injected with fn1a/1b morpholinos (MO). (B,C) Quantitation of the total numbers of membrane protrusions formed by vangl2 mutant embryos injected with fn1a/1b MO (n=5 cells, 3 embryos). The data from wild type (WT), vangl2 mutant embryos, and wild-type embryos injected with fn1a/1b MO are shown for comparison. (D) Quantitation of the total percentage of polarized large protrusions. Average values are shown ± standard deviation. ****P<0.0001; P values are versus wild type; one-way ANOVA significance test followed by Tukey HSD post-hoc tests. Scale bar, 5 μm. |
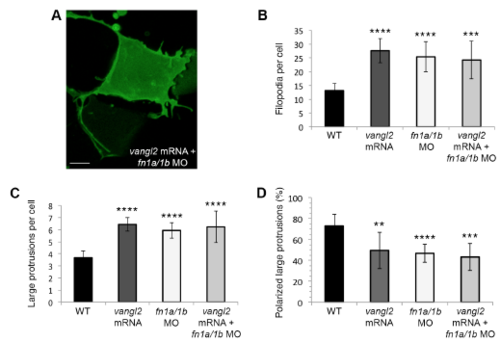
vangl2 mRNA overexpression in fn1a/1b morphant wild-type embryos. (A) Time-lapse confocal image of late gastrula cell expressing memGFP. fn1a/1b morpholino (MO) injected wild-type embryo co-injected with synthetic vangl2 mRNA. (B,C) Quantitation of the total numbers of membrane protrusions formed by wild-type embryos injected with fn1a/1b MO and vangl2 mRNA (n=5 cells, 4 embryos). The data from wild type (WT), vangl2 mRNA injected wild-type embryos, and fn1a/1b MO injected wildtype embryos are shown for comparison. (D) Quantitation of the total percentage of polarized large protrusions. Average values are shown ± standard deviation. **P<0.01, ***P<0.001, ****P<0.0001; P values are versus wild type; one-way ANOVA significance test followed by Tukey HSD post-hoc tests. Scale bar, 5 μm. |
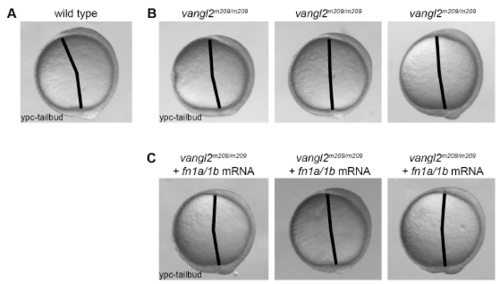
Injection of fn1a/1b mRNA fails to rescue the vangl2 mutant embryo convergence and extension phenotype. (A) Lateral view of a wild-type embryo at the yolkplug closure (YPC)-tailbud stage. Black lines denote the polster-tailbud angle. (B) Lateral views of three vangl2m209/m209 embryos highlighting subtle variations in the mutant convergence and extension phenotype. (C) Lateral views of three vangl2m209/m209 embryos injected with fn1a/1b mRNA (n=50 mRNA injected homozygous mutant embryos analyzed). |