
- Title
-
Characterization of retinal regeneration in adult zebrafish following multiple rounds of phototoxic lesion
- Authors
- Ranski, A.H., Kramer, A.C., Morgan, G.W., Perez, J.L., Thummel, R.
- Source
- Full text @ Peer J.
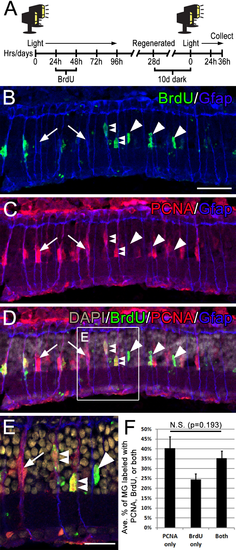
Following consecutive rounds of light damage, different populations of Müller glia re-enter the cell cycle.(A) Timeline of the BrdU and light lesion, fish were exposed to two rounds of light lesion separated by 28 day period of standard light/dark cycling. (B–D) Retinal sections collected at 36 hpL immunolabeled with anti-GFAP (blue), anti-BrdU (green), anti-PCNA (red) and DAPI (nuclear stain; grey). Arrowheads point to BrdU-positive cells, arrows point to PCNA-positive cells, and double arrowheads point to cells co-immunolabeled with both PCNA and BrdU. (E) An inset of image D. (F) Quantification of the average numbers of BrdU-positive cells (24%), PCNA positive cells (40%) and co-labeled cells (35%) counted over a linear distance of 300 µm on the central dorsal retina following two consecutive rounds of light damage. Scale bar represents 25 µm in B and 12 µm in E. EXPRESSION / LABELING:
|
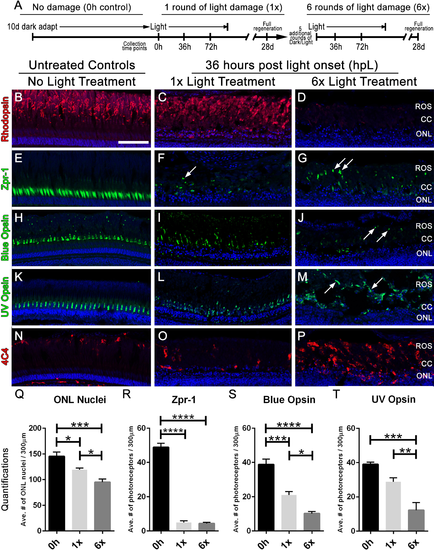
Multiple rounds of light treatment leads to greater photoreceptor loss at 36 h of light treatment.(A) Experimental design used for multiple rounds of light treatment. (B–P) Retinal sections collected at 36 hpL immunolabeled with anti-rhodopsin, Zpr-1, anti-blue opsin, anti-UV opsin, and 4C4 to show the varying amounts of damage to photoreceptors in untreated control (No Light Treatment), experimental control (1×Light Treatment), and experimental retinas (1×Light Treatment). Nuclei are stained blue with TO-PRO-3. (B–D) Rod photoreceptor outer segments are immunolabeled with anti-rhodopsin (red). (E–G) Red-green double cones are immunolabeled with Zpr-1 (green). (H–J) Long single cones are immunolabeled with anti-blue opsin (green). (K–M) Short single cones are immunolabeled with anti-UV opsin (green). (N–P) Microglia/macrophages are immunolabeled with 4C4 (red). In the images taken after six rounds of light treatment, arrows point to individual cone opsins in the large debris field. (Q–T) Quantification of average numbers of photoreceptors in untreated (0h), control (1×) and experimental (1×) groups (n = 5 per group) counted over a linear distance of 300 µm on the central dorsal retina. Asterisks indicates significant differences between groups (four asterisks p < 0.0001; three asterisks p < 0.0003; two asterisks p < 0.006; one asterisk p < 0.02). Scale bar represents 25 μm. |
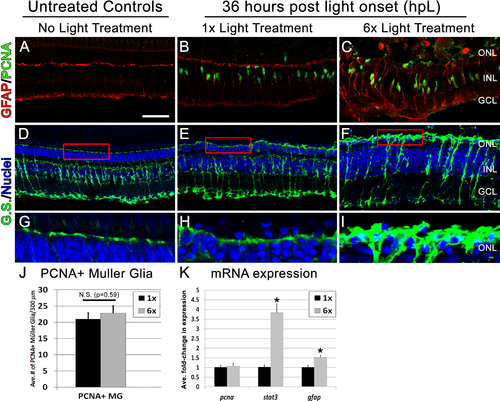
Following six rounds of light treatment Müller glia become highly unorganized and exhibit gliotic characteristics.(A–C) Retinal sections collected at 36 hpL immunolabeled with anti-GFAP (red), and anti-PCNA (green) in untreated control (No Light Treatment), experimental control (1×Light Treatment), and experimental retinas (1×Light Treatment). (D–F) Retinal sections collected at 36 hpL immunolabeled with anti-glutamine synthetase (G.S.; green) and TO-PRO-3 as nuclear stain (blue). (G–I) Magnified inset of regions indicated by red box in (D–F). (J) Quantification of average number of PCNA positive Müller glia in experimental control and experimental groups (n = 5). Cells were counted over a linear distance of 300 µm on the central dorsal retina. (K) Graph showing the average fold-change in expression of genes associated with proliferation (pcna) and gliosis/stress (stat3, gfap) as determined by real-time qPCR. Asterisk indicates significantly different from control (p < 0.05). Scale bar represents 25 μm. |

Following six rounds of light treatment Müller glia remain persistently gliotic at the canonical peak stage of progenitor proliferation and migration.(A–I) Retinal sections collected at 72 hpL immunolabeled with anti-GFAP (red) and anti-PCNA (green) in untreated control (No Light Treatment), experimental control (1×Light Treatment), and experimental retinas (1×Light Treatment). (A–C) Müller glia are immunolabeled with anti-GFAP. (D–F) Müller glia that have re-entered the cell cycle are immunolabeled with anti-PCNA. (G–I) Merge of anti-GFAP and anti-PCNA immunolabeling. (J) Graph showing the average fold-change in expression of genes associated with (1) general proliferation (cdk1, c-jun), (2) retinal regeneration (shha, shhb, pcna, pax6a, pax6b, six3b and tgif1), (3) Müller cell function (glulb, gfap, kcnj10a, rlbp1b, vim), and (4) RPE function (rlbp1a). Asterisk indicates significantly different from control (p < 0.05). Scale bar represents 25 μm. |
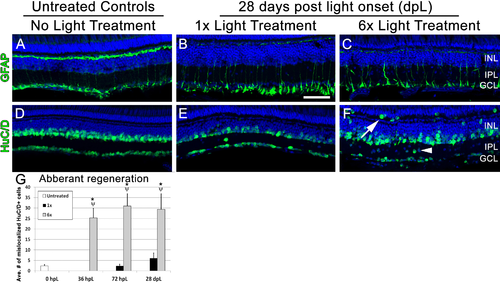
Following multiple rounds of regeneration, retinas exhibit abnormal localization of inner retinal neurons.(A–F) Retinal sections collected at 28 dpL immunolabeled with anti-GFAP and anti-HuC/D to show Müller glia and inner retinal neurons, respectively, in untreated control (No Light Treatment), experimental control (1×Light Treatment) and experimental retinas (1×Light Treatment). Nuclei are stained in blue with TO-PRO-3. (A–C) Müller glia are immunolabeled with anti-GFAP. (D–F) Amacrine and ganglion cells are immunolabeled with anti-HuC/D. Mis-localization of HuC/D-positive cells were observed in the inner plexiform layer (IPL; arrowhead) and outer retina (arrow). (G) Quantification of average numbers of HuC/D-positive cells found in the IPL and outer retina (n = 5 per group). Cells were counted over a linear distance of 300 μm on the central dorsal retina. Asterisk indicates significantly different from 0 h control; Psi symbol indicates significantly different from 1×retinas (p < 0.05). Scale bar represents 25 μm. PHENOTYPE:
|
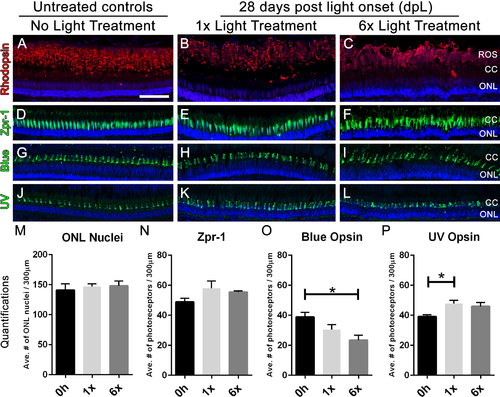
Following six rounds of light treatment, retinas replace the lost photoreceptors.(A–L) Retinal sections collected at 28 dpL immunolabeled with anti-rhodopsin, Zpr-1, anti-blue opsin, and anti-UV opsin to show regeneration of the photoreceptors in untreated control (No Light Treatment), experimental control (1×Light Treatment), and experimental retinas (1×Light Treatment) following photolytic damage. S Nuclei are stained blue with TO-PRO-3. (A–C). Rod photoreceptor outer segments are immunolabeled with anti-rhodopsin (red). (D–F) Red-green double cones are immunolabeled with Zpr-1 (green). (G–I) Long single cones are immunolabeled with anti-blue opsin (green). (J–L) Short single cones are immunolabeled with anti-UV opsin (green). (M–P) Quantification of the average number of photoreceptors 28 dpL in control and experimental groups (n = 5). Cells were counted over a linear distance of 300 µm on the central dorsal retina. Single asterisks indicate significant differences between groups (p < 0.03). Scale bar represents 25 μm. PHENOTYPE:
|
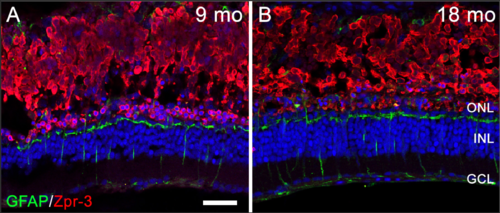
Comparison of photoreceptor degeneration and GFAP expression at 36 hpL between 9 and 18 mo zebrafish (A–B) Retinal sections from 9 mo (A) and 18 mo (B) zebrafish immunolabeled with GFAP (Müller glia; green), Zpr-3 (Rod photoreceptors; red), and the nuclear stain TO-PRO-3 (blue). No differences in Müller glial reactivity or photoreceptor degeneration was observed. Scale bar represents 25 μm. |